Blog

Foreclosures Relatively Stable in 2012, Some States Expected to Rise in 2013
Therernwere a total of 2,304,941 foreclosure filings in the United States in 2012rnaffecting 1,836,634 properties or one in every 72 residential units. This is only a 3 percent decrease from 2011rnwhen 1,887,777 properties received a filing but is down 36rnpercent from the peak year of 2010 when 2.9 million properties werernaffected. </p
The 2012 figures along with Decemberrnand 4th Quarter data were reported today by RealtyTrac, an Irvine,rnCalifornia company that tracks documentsrnfiled in all three stages of foreclosure:</p
2. Auction – Notice of Trustee Sale and Notice of Foreclosure Salern(NTS and NFS): if the borrower does not catch uprnon their payments the lender will file a notice of sale (the lender intends tornsell the property). This notice is published in local paper and containsrninformation pertaining to the date, time and subject property address. </p
 </p
</p
Foreclosure activity was up year over year inrn25 states including 20 that are primarily judicial foreclosurernjurisdictions. The largest increases</bwere in New Jersey (+55 percent), Florida (+53 percent), Connecticut (+48rnpercent), and Indiana (+46 percent). Filingsrndecreased in 25 states, 19 of which use the more streamlined non-judicialrnprocess. The largest declines were inrnNevada (-57 percent), Utah and Oregon (-40 percent) and Arizona (-33 percent.)</p
Florida posted the nation’s highest foreclosurernrate with one in 42 housing units or 3.11 percent receiving a foreclosurernfiling followed by Nevada (2.70 percent), Arizona (2.69 percent), and Georgiarnand Illinois each at 2.58 percent.</p
While the rate of foreclosurernactivity was little changed for the year, it has been steadily declining inrnrecent months. There were foreclosurernfilings on 162,511 properties in December, down 10 percent from November andrnwere the lowest total since April 2007. rnAll three types of filings decreased on both a monthly and arnyear-over-year basis in December. </p
Fourth quarter activity was thernlowest since the third quarter of 2007 even though bank repossessions were up 9rnpercent. There were filings on 503,462rnproperties, a 5 percent decrease from the third quarter and a 14 percentrndecrease from the fourth quarter of 2011. rn</p
The average time to complete arnforeclosure increased by 8 percent, from 348 days in the third quarter to arnrecord high of 414 days in the fourth. rnNew York had the longest average time to foreclose at 1,089 daysrnfollowed by New Jersey at 987 days and Florida at 853 days.</p
 </p
</p
“2012 was the year of the judicialrnforeclosure, with foreclosure activity increasing from 2011 in 20 of the 26rnstates that primarily use the judicial process, and a judicial state – Floridarn- posting the nation’s highest state foreclosure rate for the first time sincernthe housing crisis began,” said Daren Blomquist, vice president at RealtyTrac.rn”Meanwhile foreclosure activity continued to decline in 19 of the 24 statesrnthat use the more streamlined non-judicial foreclosure process, but there couldrnbe a backlog of delayed foreclosures building up in some of those states asrnwell as the result of recent state legislation and court rulings that raise thernbar for lenders to foreclose. </p
“That could mean that althoughrnwe are comfortably past the peak of the foreclosure problem nationally, 2013 isrnlikely to be book-ended by two discrete jumps in foreclosure activity,”rnBlomquist added. “We expect to see continued increases in judicialrnforeclosure states near the beginning of the year as lenders finish catching uprnwith the backlogs in those states, and another set of increases in somernnon-judicial states near the end of the year as lenders adjust to the new lawsrnand process some deferred foreclosures in those states.”</p
 </p
</p
As of the end of the year, more thanrn1.5 million homes were in some stage of foreclosure or bank-owned, up 9 percentrnfrom the end of 2011, but still 31 percent below the peak of 2.2 million at thernend of 2010. Foreclosure inventory had dropped to a 57-month low of 1.3 millionrnin May 2012, but has since risen off that 57-month low.</p
The largest inventory was in Floridarnwhere 305,766 properties were in some state of foreclosure or bank owned. That is 20 percent of the national total; anotherrn14 percent or 212,172 properties were in California’s inventory. The three big government-related housingrnentities Freddie Mac, Fannie Mae and the Department of Housing and Urban Developmentrnowned a combined total of 26 percent of the REO in the country followed by Bankrnof America and Wells Fargo with 8 percent and 6 percent respectively. </p
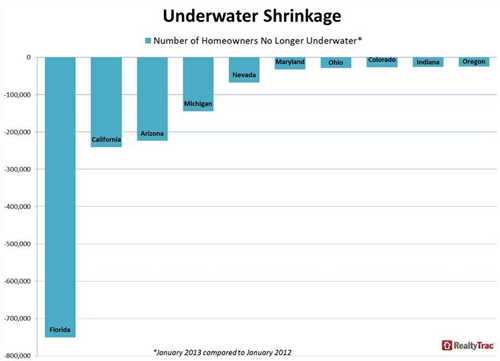
Nationwide the average monthlyrnmedian home price during the first 10 months of 2012 was $164,712, virtually unchangedrnfrom the same period in 2011 but during that period median prices rose in 25rnstates. This may in turn have helped reduce the number of seriously underwaterrnhomeowners, those who owe at least 25 percent more on their mortgages than thernvalue of their homes, to 10.9 million at the beginning of 2013 from 12.5rnmillion at the beginning of 2011.</p

All Content Copyright © 2003 – 2009 Brown House Media, Inc. All Rights Reserved.nReproduction in any form without permission of MortgageNewsDaily.com is prohibited.
Latest Articles
By John Gittelsohn August 24, 2020, 4:00 AM PDT Some of the largest real estate investors are walking away from Read More...
Late-Stage Delinquencies are SurgingAug 21 2020, 11:59AM Like the report from Black Knight earlier today, the second quarter National Delinquency Survey from the Read More...
Published by the Federal Reserve Bank of San FranciscoIt was recently published by the Federal Reserve Bank of San Francisco, which is about as official as you can Read More...

Comments
Leave a Comment