
Blog

Home Price Gains Outstripping Inflation
Twornmajor indicators of home price trends released today showed continuedrnappreciation although larger gains were reported by the S&P/Case-ShillerrnHome Price Indices than by the Federal Housing Finance Agencies Housing PricernIndex, both of which use the acronym HPI. rnThe Case-Shiller HPI report covered June 2015 while FHFA released datarnfor both June and for the second quarter of 2015.</p
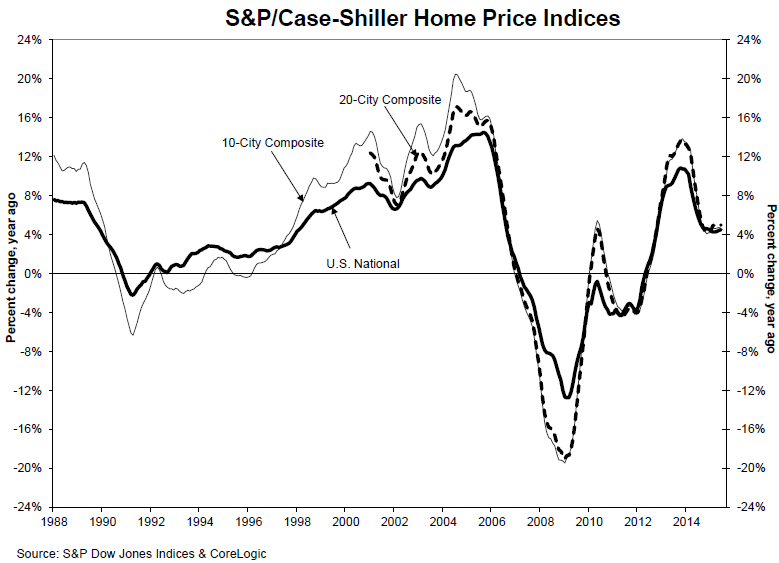
CasernShiller’s U.S. National HPI which covers all nine U.S. census divisions showedrnhome prices gaining 4.5 percent in June 2015 compared to June 2014. This was a slightly larger year-over-yearrngain than reported in May when annual prices were up 4.4 percent. The 10-City Composite Index was 4.6 percentrnhigher than a year earlier, a slightly lower increase than in May while thern20-City Composite gained 5.0 percent year-over-year, virtually the same as in thernprevious month. </p
The National Index and the 20-CityrnComposite both rose 1.0 percent from the May level on a non-seasonally adjustedrnbasis while the 10-City showed 0.9 percent monthly appreciation. On a seasonally adjusted bases the NationalrnIndex maintained a 1.0 percent gain while the two city composites each lost 0.1rnpercent. All 20 cities reported increases in June before seasonal adjustment;rnafter seasonal adjustment, nine were down, nine were up, and two werernunchanged.</p
 </p
</p
The largest annual gains were reported byrnDenver at 10.2 percent, the only city in double digits, followed by SanrnFrancisco and Dallas at 9.5 percent and 8.2 percent respectively. Annual appreciation was higher in June thanrnMay in 11 cities. </p
Phoenix and Detroit, both cities hard hitrnby the recession, now have the longest running streaks of annual home pricernappreciation; Phoenix, marked its seventh consecutive increase with a gain ofrn4.1 percent in June while Detroit posted a sixth increase. That 5.7 percent increase brought Detroit,rnthe last city to remain below the January 2000=100 base for the indices backrnover that benchmark for the first time since the recession began. </p
David M. Blitzer, Managing Director andrnChairman of the Index Committee at S&P Dow Jones Indices noted that therncontinued national increase in home prices of 4 to 5 percent is two to threerntimes the rate of inflation. “Whilernprices in San Francisco and Denver are rising far faster than those inrnWashington DC, New York, or Cleveland, the city-to-city price patterns are littlernchanged in the last year,” he said. “Washingtonrnsaw the smallest year-over-year gains in five of the last six months; SanrnFrancisco and Denver ranked either first or second of all cities in the lastrnfive months. The price gains have been consistent as the unemployment raterndeclined with steady inflation and an unchanged Fed policy.</p
“The missing piece in the housingrnpicture has been housing starts and sales. These have changed for the better inrnthe last few months. Sales of existing homes reached 5.6 million at annualrnrates in July, the strongest figure since 2007. Housing starts topped 1.2rnmillion units at annual rates with almost two-thirds of the total in singlernfamily homes. Sales of new homes are also trending higher. These data point torna stronger housing sector to support the economy. Two possible clouds on thernhorizon are a possible Fed rate increase and volatility in the stock market. Arnone quarter-point increase in the Fed funds rate won’t derail housing. However,rnif the Fed were to quickly follow that initial move with one or two more rate increases,rnhousing and home prices might suffer. A stock market correction is unlikely to do much damage to thernhousing market; a full blown bear market dropping more than 20 percent wouldrnpresent some difficulties for housing and for other economic sectors.”</p
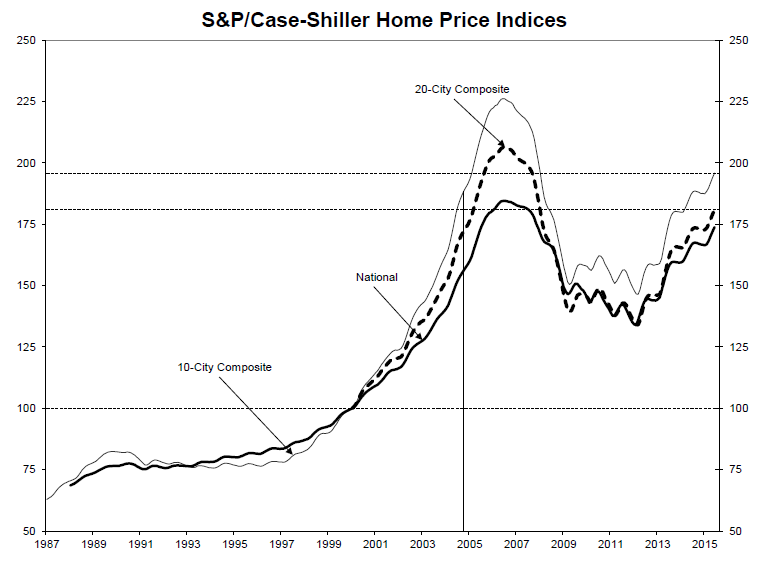
As of June average home prices forrnmetropolitan areas within the 10- and 20-City Composites are back to winterrn2005 levels. The two indices are downrnapproximately 12 to 14 percent from the price peaks they reached in June/Julyrn2005. Since prices hit their post-crisisrnlow points in March 2012 the 10-City has recovered by 33.8 percent and thern20-City by 34.9 percent. </p
 </p
</p
The S&P/Case-Shiller Home Price Indices are constructed to accurately track the pricernpath of typical single-family home pairs for thousands of individual housesrnfrom the available universe of arms-length sales data. The S&P/Case-ShillerrnNational U.S. Home Price Index tracks the value of single-family housing withinrnthe United States. The indices have a base value of 100 in January 2000; thus,rnfor example, a current index value of 150 translates to a 50% appreciation rate</bsince January 2000 for a typical home located within the subject market.</p
The 10-City Composite currently has anrnindex level of 195.89 and the 20-City a value of 180.88. The National Index is at 173.84. Detroit is the city with the lowest index atrn102.87 and Los Angeles has the highest at 237.54</p
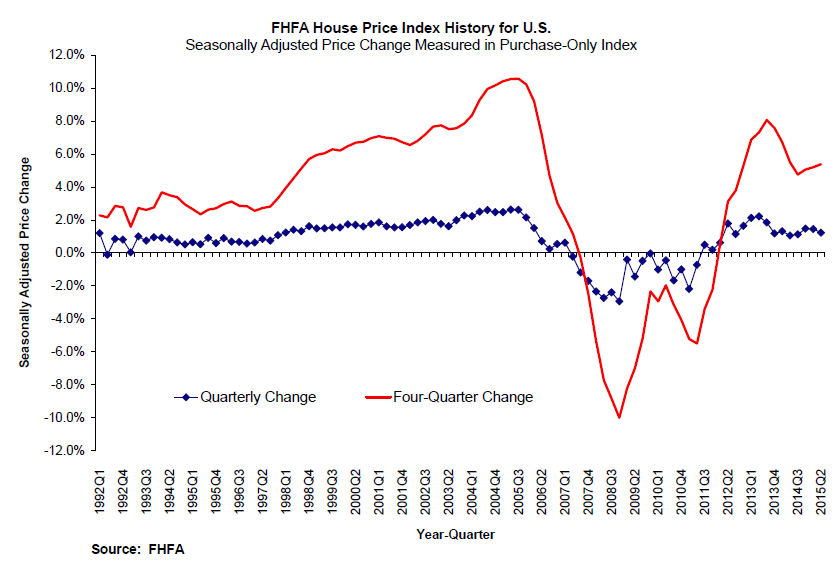
The FHFA HPI reported arnmonth-over-month increase in home prices of 0.2 percent in June and 1.2 percentrnfrom the first to the second quarter of 2015. rnIt was the 16th consecutive quarterly price increase for FHFA’srnpurchase only HPI. </p
House prices rose 5.4 percent from thernsecond quarter of 2014 to the same quarter this year but FHFA said the pricesrnof other goods and services declined 1.4 percent. Thus the inflation-adjustedrnprice of homes was up 6.9 percent over the 12 month period. FHFA calculates its HPI using home salesrnprice information from mortgages sold to, or guaranteed by, Fannie Mae andrnFreddie Mac.</p
 </p
</p
Homernprices rose in every state between the second quarter of 2014 and the secondrnquarter of 2015. Colorado led the states in annual appreciation with a gain ofrn10.6 percent followed closely by Nevada at 10.5 percent. The remainder of the top five areas were Floridarn(9.7 percent,) Hawaii (9.5 percent,) and Washington (8.8 percent.)</p
FourrnQuarter price appreciation leaders among the 100 most-populated metropolitanrnareas were San Francisco-Redwood City which saw a gain of 18.3 percent. Pricesrnwere weakest in the Allentown-Bethlehem metro area where they fell by 1.1rnpercent.</p
Ofrnthe nine census divisions, the South Atlantic division experienced thernstrongest increase in the second quarter, posting a 1.7 percent quarterlyrnincrease and a 6.1 percent increase since last year. House price appreciationrnwas weakest in the Middle Atlantic division, where prices were flat in thernsecond quarter.
All Content Copyright © 2003 – 2009 Brown House Media, Inc. All Rights Reserved.nReproduction in any form without permission of MortgageNewsDaily.com is prohibited.
About the Author
devteam
Steven A Feinberg (@CPAsteve) of Appletree Business Services LLC, is a PASBA member accountant located in Londonderry, New Hampshire.
See all blogsLatest Articles
By John Gittelsohn August 24, 2020, 4:00 AM PDT Some of the largest real estate investors are walking away from Read More...
Late-Stage Delinquencies are SurgingAug 21 2020, 11:59AM Like the report from Black Knight earlier today, the second quarter National Delinquency Survey from the Read More...
Published by the Federal Reserve Bank of San FranciscoIt was recently published by the Federal Reserve Bank of San Francisco, which is about as official as you can Read More...
Comments
Leave a Comment