Blog

Home Price Gains Triple Inflation, but Not Without Distressed Sales
As has every other price-related report,rnthe one issued by the Federal Housing Finance Agency (FHFA) today confirmed thernupward momentum of home prices in the first quarter of 2013. FHFA’s Home Price Index (HPI) rose 1.9rnpercent, the seventh consecutive quarter that the seasonally adjusted,rnpurchase-only index has risen. </p
The 1.9 percent quarter rise may actuallyrnunderstate a growing momentum; the seasonally adjusted index rose 1.3 percentrnjust in March, the last month of the quarter. rnThis was the 14th consecutive increase in the monthly HPI. </p
 </p
</p
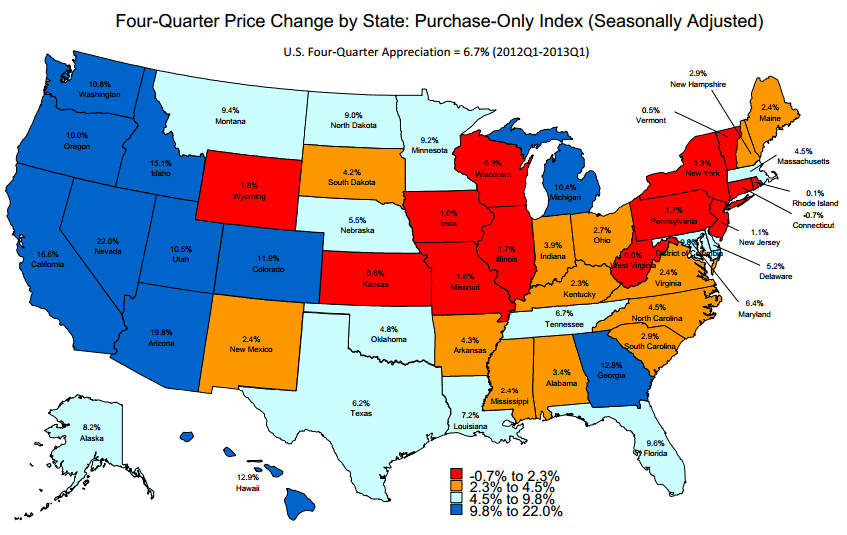
Since the first quarter of 2012 homernprices have increased 6.7 percent. FHFArnpoints out that the cost of other goods and services have risen 1.4 percentrnover the last four quarters so the inflation adjusted rise in home prices isrn5.2 percent, 3.71 times the overall rate.</p
“Thernhousing market has stabilized in many areas and homebuilding activity hasrnstrengthened in recent quarters,” FHFA principal economist Andrew Leventisrnsaid. “That said, labor market weaknessrnand still-elevated foreclosure pipelines remain hindrances to a more robustrnrecovery.”</p
The HPI is calculated from home salernprice information for mortgages purchased or guaranteed by Fannie Mae andrnFreddie Mac. FHFA recently added anrnexpanded-data HPI which adds transaction information from county recorderrnoffices and the Federal Housing Administration to regular HPI data. That expanded index also rose 1.9 percent inrnthe first quarter and was up 6.4 percent over the last four quarter.</p
The agency notes that a new series of “distress-free”rnhome price indices it generated for 12 large metropolitan areas generallyrnreport lower quarterly appreciation than do the purchase-only indices. In 11 of the 12 areas the new index, whichrnremoves the direct effect of short sales and bank owned properties (REO) showsrnlower appreciation than the traditional series. rnFor example, for the Atlanta MSA the purchase-only four quarter indexrnappreciation was 17.62 percent; for the distress-free index the appreciation overrnthe same period was 10.3 percent. ForrnChicago the numbers were 4.26 percent versus 2.9 percent respectively.</p
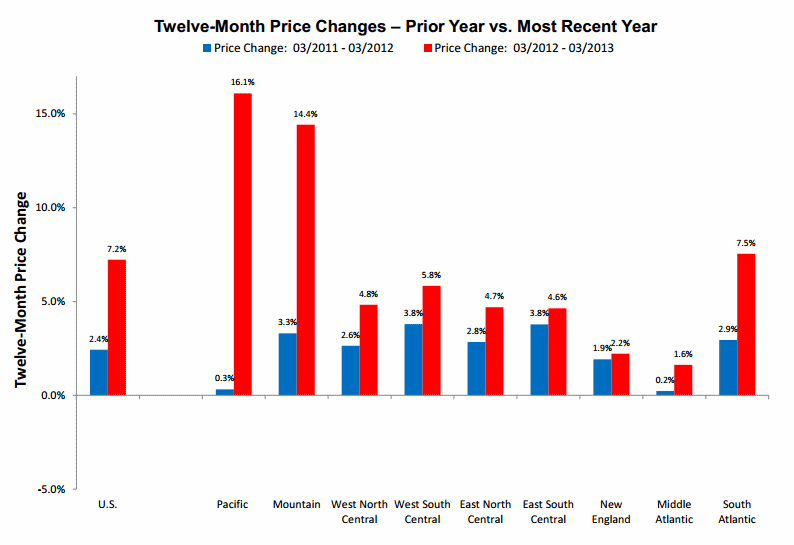
The seasonally adjusted purchase-onlyrnHPI was up in 41 states and the District of Columbia and increased on both arnquarterly and annual basis in all nine census regions. The strongest appreciation was in the PacificrnRegion which was up 2.3 percent for the quarter and 16.1 percent for thernyear. No other region came close inrnannual appreciation – the second greatest increase was 7.5 percent in the SouthrnAtlantic region. House prices werernweakest in the Middle Atlantic division, up 0.3 percent quarter over quarterrnand 1.6 percent year-over-year. </p
 </p
</p
Jacksonville, Florida had the largest increasernamong metropolitan areas, up 9.3 percent on an annual basis while prices werernweakest in the Bridgeport, Connecticut market where they fell 3.5 percent sincernthe first quarter of 2012.
All Content Copyright © 2003 – 2009 Brown House Media, Inc. All Rights Reserved.nReproduction in any form without permission of MortgageNewsDaily.com is prohibited.
Latest Articles
By John Gittelsohn August 24, 2020, 4:00 AM PDT Some of the largest real estate investors are walking away from Read More...
Late-Stage Delinquencies are SurgingAug 21 2020, 11:59AM Like the report from Black Knight earlier today, the second quarter National Delinquency Survey from the Read More...
Published by the Federal Reserve Bank of San FranciscoIt was recently published by the Federal Reserve Bank of San Francisco, which is about as official as you can Read More...

Comments
Leave a Comment