
Blog

Home Prices Accelerate in January, Posting Highest Yearly Increase Since 2006
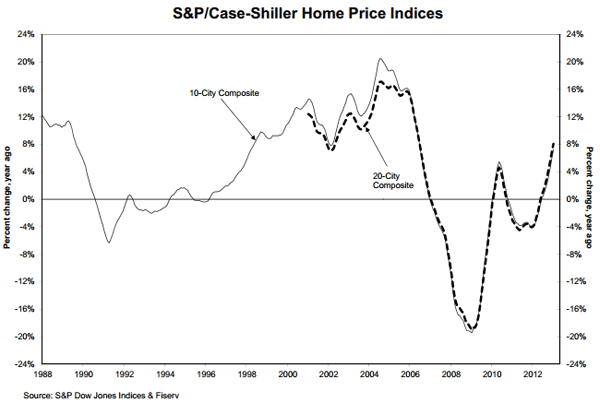
Average home prices increased in all 20 ofrnthe cities tracked by the S&P/Case-Shiller Home Price Indices over the 12rnmonths ended in January. Each ofrnCase-Shiller’s city indices also increased the 10-City Composite by 7.3 percentrnand the 20-City Composite by 8.1 percent. rnNineteen of the 20 cities had larger annual increases in January thanrnthey had in December. On a monthly basisrnthe 10-City Composite increased 0.2 percent and the 20-City was up 0.1 percent.</p
New York City had been the solernmetropolitan area to have a negative annual return in December but it turnedrnthe corner in January, ending 28 months of annual price declines with a 0.6rnpercent increase. Despite an annual gainrnof 13.8 percent Detroit was the only city in which the annual improvement inrnJanuary was smaller than that in December. Phoenix had the largest annualrnincrease in home prices, gaining 23.2 percent followed by San Francisco with a positivern17.5 percent change.</p
 </p
</p
“The two headline composites posted their highestrnyear-over-year increasesrnsince summer 2006,” says David M.rnBlitzer, Chairman of the IndexrnCommittee at S&PrnDow Jones Indices. “This marks the highestrnincrease since the housing bubble burst.</p
“After more than two years of consecutive year-over-year declines, New York reversed trend and postedrna positive returnrnin January. The Southwestrn(Phoenix and Las Vegas) plus San Francisco posted the highest annual increases;rnthey were also among the hardest hit by the housing bust. Atlanta and Dallas recorded their highest year-over-year gains.</p
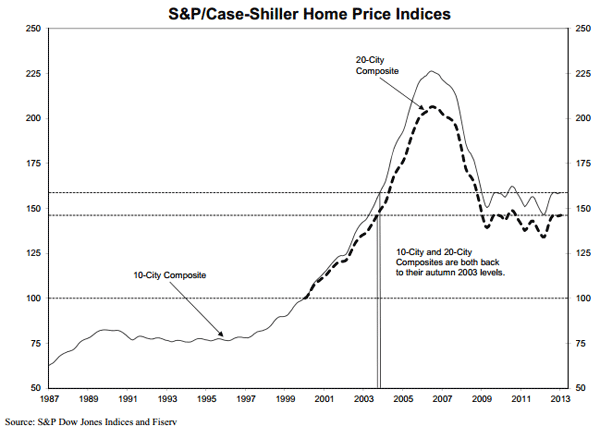
As of Januaryrnthe average home prices in the country are back to fall 2003 levels for bothrncomposites. When measured from theirrnJune/July peaks the two composites have declined about 29 percent but have risenrn8-9 percent from the low points experienced in the late winter of 2012.</p
 </p
</p
“Economic data continuesrnto support the housing recovery. Single-family home buildingrnpermits and housing starts posted double-digit year-over-year increases in February 2013. Despiterna slight uptick in foreclosure filings, numbers are still down 25% year-over-year. Steady employment and low borrowing rates pushed inventoriesrndown to their lowest post-recession levels,” Blitzer said.</p
While all 20 citiesrnincluded in the indices posted annual price increases and eight had increasesrnin double digits, only nine cities saw price increases from December tornJanuary.</p
The S&P/Case-Shiller Composites are value weighted averages of thern10 and 20 cities tracked. They have a base value of 100 in January 2000; thus, for example, a currentrnindex value of 150 translates to a 50% appreciation rate since January 2000 for a typical home located withinrnthe subject market. rnIn January two cities were indexed below 100, Detroit at 80.01 andrnAtlanta at 96.90
All Content Copyright © 2003 – 2009 Brown House Media, Inc. All Rights Reserved.nReproduction in any form without permission of MortgageNewsDaily.com is prohibited.
About the Author
devteam
Steven A Feinberg (@CPAsteve) of Appletree Business Services LLC, is a PASBA member accountant located in Londonderry, New Hampshire.
See all blogsLatest Articles
By John Gittelsohn August 24, 2020, 4:00 AM PDT Some of the largest real estate investors are walking away from Read More...
Late-Stage Delinquencies are SurgingAug 21 2020, 11:59AM Like the report from Black Knight earlier today, the second quarter National Delinquency Survey from the Read More...
Published by the Federal Reserve Bank of San FranciscoIt was recently published by the Federal Reserve Bank of San Francisco, which is about as official as you can Read More...
Comments
Leave a Comment