
Blog

Home Prices at Boom Levels in 2013
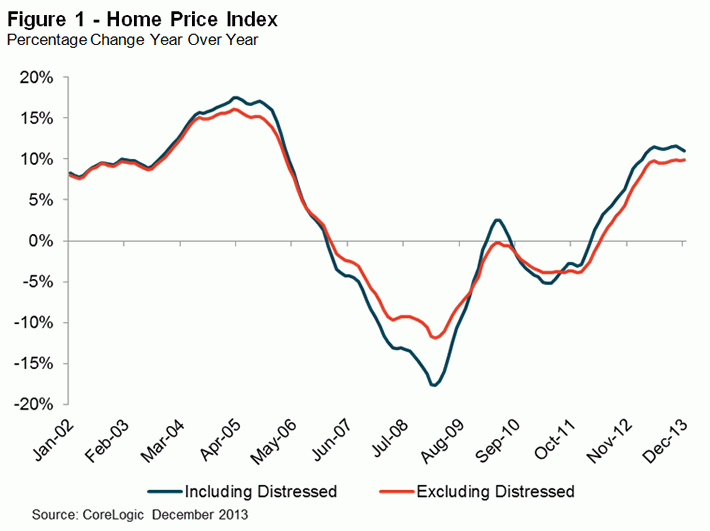
One would have to go back to the heartrnof the housing boom to find a period when home prices increased at a more rapidrnpace than they did in 2013 CoreLogic said today. While prices in December dipped slightly, thernDecember 2012 to December 2013 increase was 11 percent, the highest annualrnincrease since 2005.</p
 </p
</p
The CoreLogic Home Price Index whichrnincludes sales of distressed homes dipped 0.1 percent from November to Decemberrnbut the annual increase represented the 22nd consecutive month that pricesrnwere higher than in the same month the previous year. The HPI Index that excludes short sales andrnsales of bank owned (REO) homes increased 9.9 percent on an annual basis inrnDecember and rose 0.2 percent from November.</p
“Last year, home prices rose 11rnpercent, the highest rate of annual increase since 2005, and ten states and thernDistrict of Columbia reached new all-time price peaks,” said Dr. MarkrnFleming, chief economist for CoreLogic. “We expect the rising prices tornattract more sellers, unlocking this pent-up supply, which will have arnmoderating effect on prices in 2014.”</p
 </p
</p
CoreLogic’s Pending HPI projectsrnthat January’s home prices including distressed sales will increase 10.2rnpercent compared to January 2013 and will ease back by 0.8 percent fromrnDecember to January. Excluding distressedrnsales January 2014 home prices are poised to rise 9.7 percent year-over-year andrn0.2 percent month-over-month. ThernCoreLogic Pending HPI is based on Multiple Listing Service (MLS) data thatrnmeasures price changes for the most recent month.</p
“The healthy and broad-basedrngains in home prices in 2013 help set the stage for a continued recovery in thernhousing sector in 2014,” said Anand Nallathambi, president and CEO ofrnCoreLogic. “After six years of fits and starts, we can now see a clear pathrnto a durable recovery in single-family residential housing across most of thernUnited States.”</p
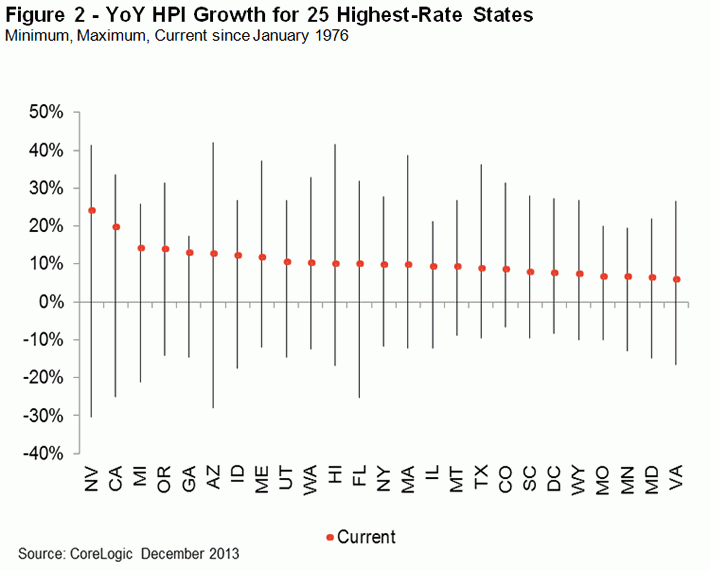
Including distressed sales, the fivernstates with the highest home price appreciation were Nevada (23.9 percent),rnCalifornia (19.7 percent), Michigan (14.0 percent), Oregon (13.7 percent) andrnGeorgia (12.8 percent). Excludingrndistressed sales, the five states with the highest home price appreciation werernNevada (20 percent), California (16.2 percent), Idaho (12.8 percent), Oregonrn(11.6 percent) and Florida (11.5 percent).</p
 </p
</p
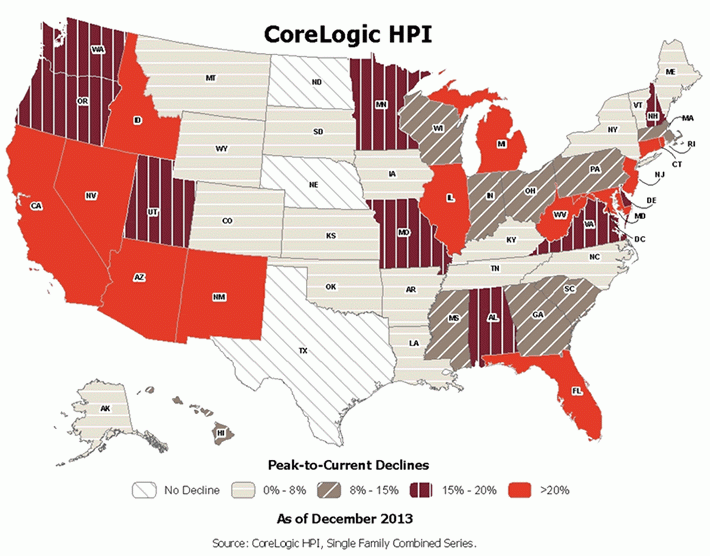
There were three states that postedrnmodest price decreases in December on the HPI which includes distressed sales;rnArkansas, New Mexico, and Mississippi saw prices ease by 1.3 to 2 percent. There were no states in the negative columnrnfor the index that excludes distressed sales. rnNinety-five of the top 100 Core Based Statistical Areas measured byrnpopulation showed year-over-year increases in December 2013. </p
The change from the peak in the nationalrnHPI which occurred in April 2006 to the December level was -18.0 percent. Excluding distressed transactions, thernpeak-to-current change in the HPI for the same period was -13.6 percent.
All Content Copyright © 2003 – 2009 Brown House Media, Inc. All Rights Reserved.nReproduction in any form without permission of MortgageNewsDaily.com is prohibited.
About the Author
devteam
Steven A Feinberg (@CPAsteve) of Appletree Business Services LLC, is a PASBA member accountant located in Londonderry, New Hampshire.
See all blogsLatest Articles
By John Gittelsohn August 24, 2020, 4:00 AM PDT Some of the largest real estate investors are walking away from Read More...
Late-Stage Delinquencies are SurgingAug 21 2020, 11:59AM Like the report from Black Knight earlier today, the second quarter National Delinquency Survey from the Read More...
Published by the Federal Reserve Bank of San FranciscoIt was recently published by the Federal Reserve Bank of San Francisco, which is about as official as you can Read More...
Comments
Leave a Comment