
Blog

Home Prices Show Largest Annual Increase in Nearly Seven Years
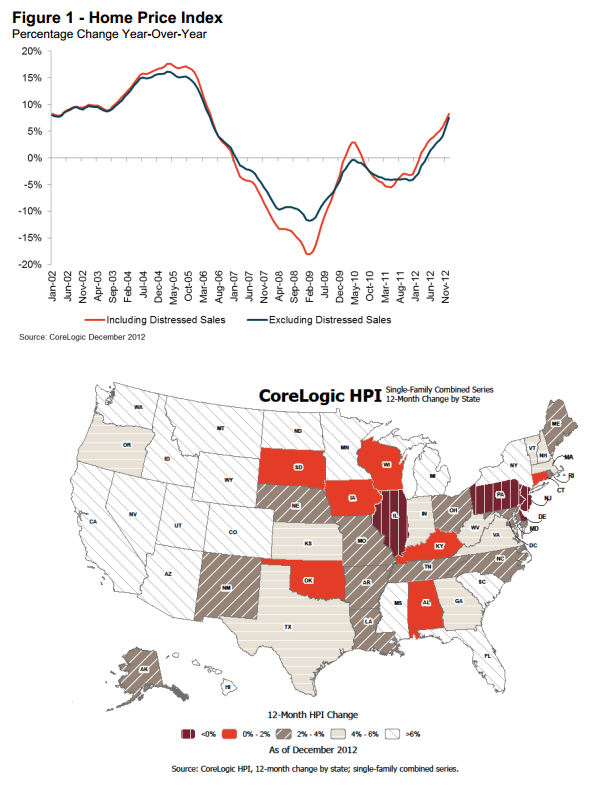
Home prices in December posted the largest annual increase inrnnearly seven years according to CoreLogic’s Home Price Index (HPI) report. December was also the 10th consecutive monthrnin which home prices increased nationally.</p
The index that included distressed sales (sales of owned realrnestate and short sales) increased by 8.3 percent compared to December 2011, thernlargest increase since May 2006. Withrndistressed sales excluded the HPI increased 7.5 percent year over year. Prices were up 0.4 percent includingrndistressed sales and 0.9 percent excluding distressed sales compared tornNovember. </p
CoreLogic’s Pending HPI including distressed sales predicts thatrnprices in January will rise by 7.9 percent on a year-over-year basis fromrnJanuary 2012 and fall by 1 percent on a month-over-month basis from Decemberrn2012, reflecting a seasonal winter slowdown. Excluding distressed sales, pricesrnare expected to rise 8.6 percent on an annual basis and 0.7 percent month overrnmonth. The CoreLogic Pending HPI is based on Multiple Listing Service (MLS)rndata that measure price changes for the most recent month.</p
“Wernare heading into 2013 with home prices on the rebound,” said Anand Nallathambi,rnpresident and CEO of CoreLogic. “The upward trend in home prices in 2012 wasrnbroad based with 46 of 50 states registering gains for the year. All signalsrnpoint to a continued improvement in the fundamentals underpinning the U.S.rnhousing market recovery.” </p
The four states in which prices decreased in December were Delawarern(-3.4 percent), Illinois (-2.7 percent), New Jersey (-0.9 percent) andrnPennsylvania (-0.5 percent). Whenrndistressed sales were excluded three states had price depreciation, Delaware (-1.9rnpercent), Alabama (-1.0 percent) and New Jersey (-0.5 percent). </p
Thernfive states with the greatest home price appreciation including distressedrnsales were Arizona (+20.2 percent), Nevada (+15.3rnpercent), Idaho (+14.6 percent), California (+12.6 percent) and Hawaii (+12.5rnpercent). Excluding distressed sales thernfive highest were Arizona (+16.4 percent), Nevada (+14.7 percent),rnCalifornia (+12.8 percent), Hawaii (+11.7 percent) and North Dakota (+10.8rnpercent).</p
Including distressed transactions, the peak-to-current change inrnthe national HPI (from April 2006 to December 2012) was -26.9 percent.rnExcluding distressed transactions, the peak-to-current change in the HPI forrnthe same period was -20.8 percent.</p
Of the top 100 Core Based Statistical Areas (CBSAs) measured byrnpopulation, only 16 are showing year-over-year declines in December, two fewerrnthan in November. </p
All Content Copyright © 2003 – 2009 Brown House Media, Inc. All Rights Reserved.nReproduction in any form without permission of MortgageNewsDaily.com is prohibited.
About the Author
devteam
Steven A Feinberg (@CPAsteve) of Appletree Business Services LLC, is a PASBA member accountant located in Londonderry, New Hampshire.
See all blogsLatest Articles
By John Gittelsohn August 24, 2020, 4:00 AM PDT Some of the largest real estate investors are walking away from Read More...
Late-Stage Delinquencies are SurgingAug 21 2020, 11:59AM Like the report from Black Knight earlier today, the second quarter National Delinquency Survey from the Read More...
Published by the Federal Reserve Bank of San FranciscoIt was recently published by the Federal Reserve Bank of San Francisco, which is about as official as you can Read More...
Comments
Leave a Comment