Blog

Home Prices Surge, With or Without Distressed Sales
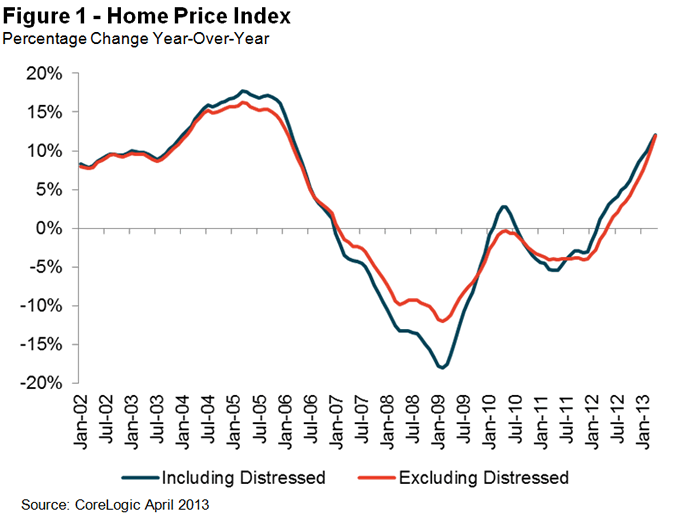
According to thernCoreLogic April Home Price Index (HPI) including distressed sales home prices are now up 12.1 percent on an annual basis. In March thernannual increase was 10.5 percent. The April year-over-year changernis the largest increase since February 2006. The HPI which excludesrnshort sales and sales of owned real estate (REO) was up 11.9 percentrnin April 2013 compared to April 2012 It had risen 10.7 percent fromrnMarch to March.</p
 </p
</p
On arnmonth-over-month basis the index including distressed sales increasedrn3.2 percent and the index excluding those sales was up 3 percent. This was the 14th straight month that the inclusive indexrnincreased nationally. </p
“Housernprice growth continues to surprise to the upside with an impressivern12.1 percent gain year over year in April,” said Dr. MarkrnFleming, chief economist for CoreLogic. “Increasing demand forrnnew and existing homes, coupled with low inventory, has created arnvirtuous cycle for price gains, most clearly seen in the Westernrnstates with year-over-year gains of 20 percent or more.”</p
Looking ahead,rnCoreLogic’s Pending HPI is predicting that May home prices, includingrndistressed sales will rise 12.5 percent on an annual basis and 2.7rnpercent month-over-month. The Pending HPI excluding distressed salesrnis expected to rise 13.2 percent and 3.1 percent respectively. ThernPending HPI bases its estimates on data from Multiple ListingrnServices.</p
“The pacernof the housing market recovery quickened in April as home prices rosernacross the U.S.,” said Anand Nallathambi, president and CEO ofrnCoreLogic. “For the second consecutive month, all 50 states</bregistered year-over-year home price gains excluding sales ofrndistressed homes. We expect this trend to continue, bolstered byrntight supplies and pent up buyer demand."</p
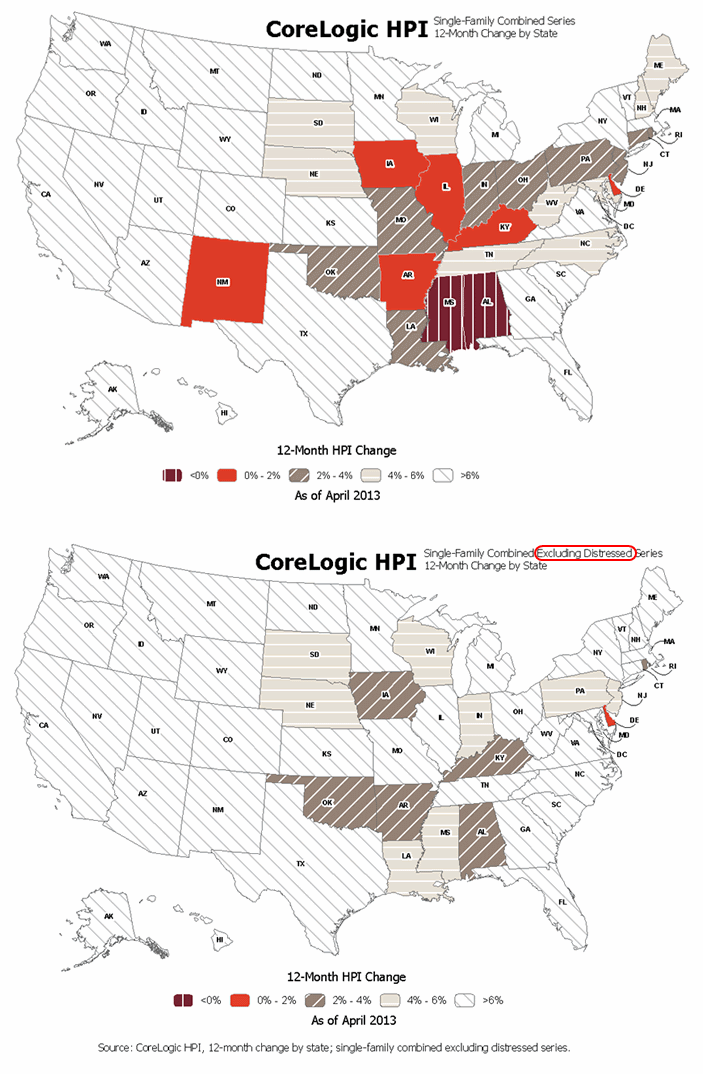
The five states</bwith the highest annual price appreciation excluding distressed salesrnwere Nevada (+24.6 percent), California (+19.4 percent), Arizonarn(+17.3 percent), Hawaii (+17 percent) and Oregon (+15.5 percent). Excluding distressed sales, the leaders were Nevada (+22.6 percent),rnCalifornia (+18.3 percent), Idaho (+16.4 percent), Arizona (+15.3rnpercent) and Washington (+13.9 percent.)</p
Two states lostrnground on the overall index, Mississippi’s prices were down 1.7rnpercent and Alabama’s 1.6 percent. There were not states with pricerndeclines when distressed sales were excluded. </p
 </p
</p
Includingrndistressed transactions, the peak-to-current change in the nationalrnHPI (from April 2006 to April 2013) was -22.4 percent. Excludingrndistressed transactions, the peak-to-current change in the HPI forrnthe same period was -16.3 percent.
All Content Copyright © 2003 – 2009 Brown House Media, Inc. All Rights Reserved.nReproduction in any form without permission of MortgageNewsDaily.com is prohibited.
Latest Articles
By John Gittelsohn August 24, 2020, 4:00 AM PDT Some of the largest real estate investors are walking away from Read More...
Late-Stage Delinquencies are SurgingAug 21 2020, 11:59AM Like the report from Black Knight earlier today, the second quarter National Delinquency Survey from the Read More...
Published by the Federal Reserve Bank of San FranciscoIt was recently published by the Federal Reserve Bank of San Francisco, which is about as official as you can Read More...

Comments
Leave a Comment