Blog

Jobless Claims Led Higher by Layoffs in Manufacturing and Construction
The Department of Labor this morning released the Unemployment Insurance Weekly Claims report, also known as Jobless Claims.
This data set tracks new filings for unemployment insurance benefits and the number of Americans who continue to receive state unemployment benefits (called continuing claims or insured unemployment). The fact that this data is released on a weekly basis makes it very appealing to traders and economists as it provides a week over week view into the health of the domestic labor market. Trader's and economists are looking for hints for answers to questions like: Are jobs being created? Are jobs being lost? Does the trend indicate more job losses ahead? Does the trend indicate firms are expanding and hiring more in the process?
Consumers drive output of goods and services in the US. The more workers earn, the more income they have to spend. The more consumers spend the more the economy grows. Because this labor market data has such large implications over the future consumer spending, Jobless Claims are a component of the Leading Economic Indicators.
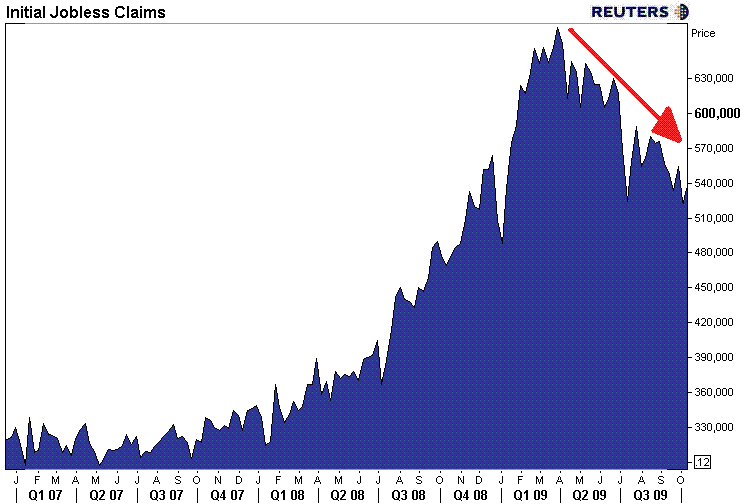
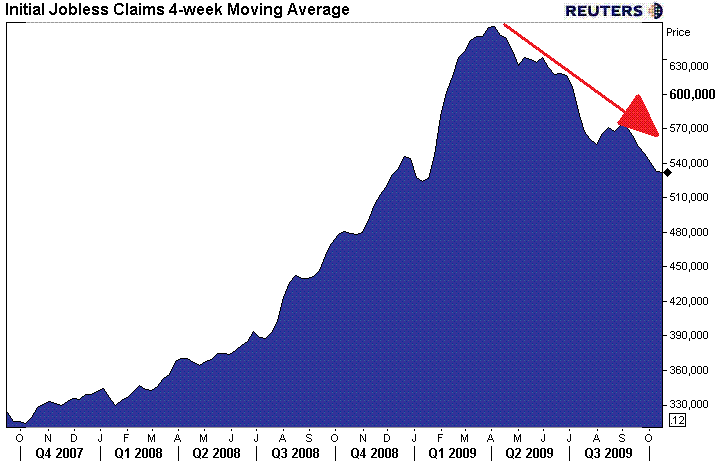
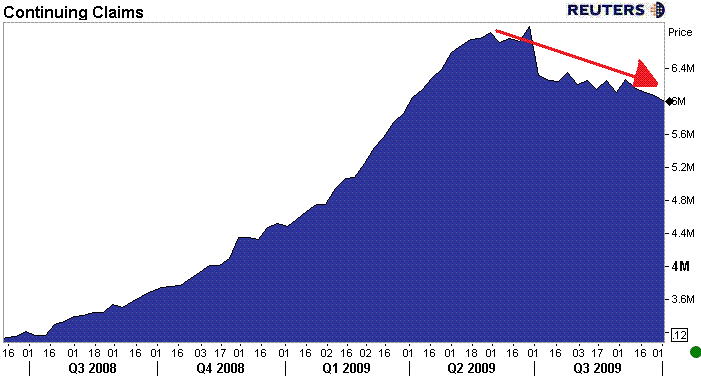
Last week, the Department of Labor reported that Initial Jobless Claims fell to 514,000 in the week ending October 10, 2009. This was the lowest read on Initial Claims since January 2009 and the fifth week in the past six where Initial Jobless Claims fell, which lowered the four week average to 531,500. Meanwhile, Continuing Claims fell 75,000 to 5.992 million, the first time Continuing Claims fell below 6.00 million since March.
From the Department of Labor…
In the week ending Oct. 17, the advance figure for seasonallyrnadjusted initial claims was 531,000, an increase of 11,000 from thernprevious week's revised figure of 520,000.

The 4-week moving averagernwas 532,250, a decrease of 750 from the previous week's revised averagernof 533,000.

Thernadvance number for seasonally adjusted insured unemployment (CONTINUING CLAIMS) during thernweek ending Oct. 10 was 5,923,000, a decrease of 98,000 from thernpreceding week's revised level of 6,021,000. The 4-week moving averagernwas 6,030,750, a decrease of 59,250 from the preceding week's revisedrnaverage of 6,090,000. The advance seasonally adjusted insured unemploymentrnrate was 4.5 percent for the week ending Oct. 10, a decrease of 0.1rnpercentage point from the prior week's revised rate of 4.6 percent.

States reported the following observations about the make up of unemployment…
From the Department of Labor…
STATES WITH A DECREASE OF MORE THAN 1,000
——————————————————————————–
California -7,062: Fewer layoffs in the construction, trade, service, and manufacturing industries.
——————————————————————————–
STATES WITH AN INCREASE OF MORE THAN 1,000
——————————————————————————–
South Carolina +1,247 : Layoffs in the manufacturing industry.
Pennsylvania +1,253: Layoffs in the service and transportation equipment industries.
Missouri +1,373:Layoffs in the service, transportation, and warehousing industries.
Georgia +1,500: Layoffs in the service and manufacturing industries.
Texas +1,631: Layoffs in the transportation, service, and manufacturing industries.
Washington +1,740: Layoffs in the transportation, warehousing, and manufacturing industries.
Iowa +2,181: Layoffs in the manufacturing industry.
Kansas +2,544 : Layoffs in the manufacturing industry.
Maryland +2,783: Layoffs in the trade and service industries.
Illinois +3,172: Layoffs in the trade and service industries.
Arkansas +4,704: Layoffs in the construction industry.
Indiana +4,977: Layoffs in the automobile and manufacturing industries.
Wisconsin +4,999: Layoffs in the trade, service, and manufacturing industries.
New York +5,411: Layoffs in the construction, service, and manufacturing industries.
Florida +9,976: Layoffs in the construction, trade, service, and manufacturing industries, and agriculture
Notice where most of the layoffs are occurring???
CONSTRUCTION AND MANUFACTURING
Last week's data was revised higher while this week's release indicated an increase in new jobless claims. The spike in new claims in the manufacturing and construction sectorsrnraises concern that the 8 month trend of declining new jobless claims was arnfunction of government stimulus stimulated consumer demand which mayrnhave temporarily increased demand for labor.
While there are seasonal adjustment factors that contribute to thisrnfluctuation, the fact that new jobless claims are failing to fall on arnconsistent basis is troubling. However, before we can make anyrnassumptions about amplified weakness in the labor market, we mustrnobserve a new trend of increasing or stubbornly high new joblessrnclaims.
Looking ahead, it is in our view that the amount of cost cutting performed by many firms combined with seasonal consumer demand influences will result in periods of temporary employment and thus volatility in labor market data. Unfortunately, as hiring rates remain near record low levels, it is expected that the rate of government insured unemployed Americans will remain high.
All Content Copyright © 2003 – 2009 Brown House Media, Inc. All Rights Reserved.nReproduction in any form without permission of MortgageNewsDaily.com is prohibited.
Latest Articles
By John Gittelsohn August 24, 2020, 4:00 AM PDT Some of the largest real estate investors are walking away from Read More...
Late-Stage Delinquencies are SurgingAug 21 2020, 11:59AM Like the report from Black Knight earlier today, the second quarter National Delinquency Survey from the Read More...
Published by the Federal Reserve Bank of San FranciscoIt was recently published by the Federal Reserve Bank of San Francisco, which is about as official as you can Read More...

Comments
Leave a Comment