
Blog

Lower Credit Borrowers and Older Loans Buoy Prepayment Speeds
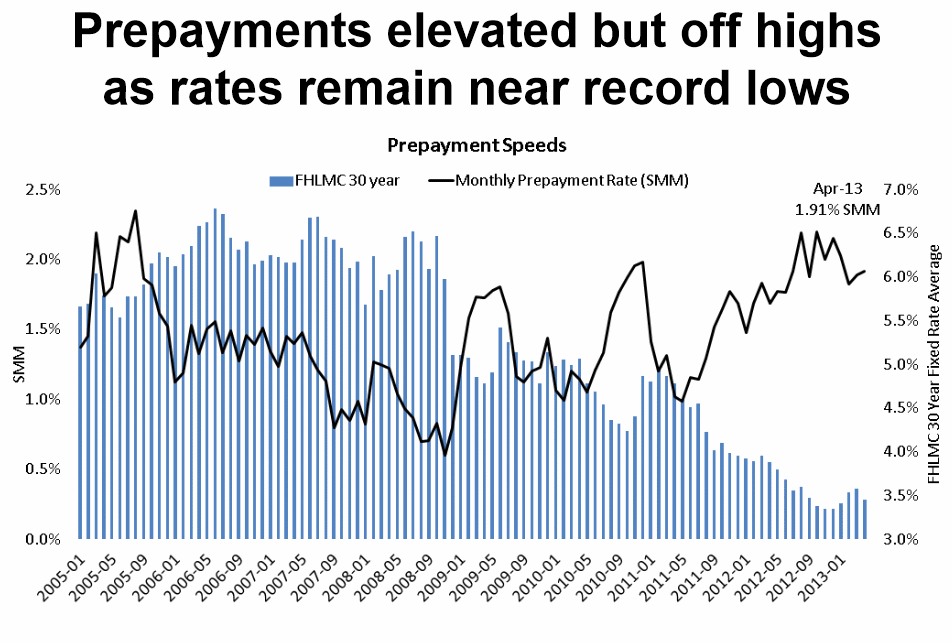
Amongrnthe areas of focus in the most recent edition of Lender ProcessingrnService’s (LPS) MortgagernMonitor are the metricsrnsurrounding the market for refinancing. In the report, which coversrndata for April which precedes the recent interest rate increases, LPSrnfirst looked at prepayment speeds which it calls a good historicrnindicator of refinance activity. It found that these speeds, whilerndown from recent highs, remained elevated, particularly among older loan vintages and lower credit borrowers. This is consistent with the view that lenders–having tightened guidline overlays shutting less qualified borrowers out of the market when rates bottomed–would eventually “move on” to loan files that weren’t considered low-hanging fruit until rates began rising in 2013. The relatively hotter purchase market has also resulted in prepayments from move-up buyers selling their previous homes. </p
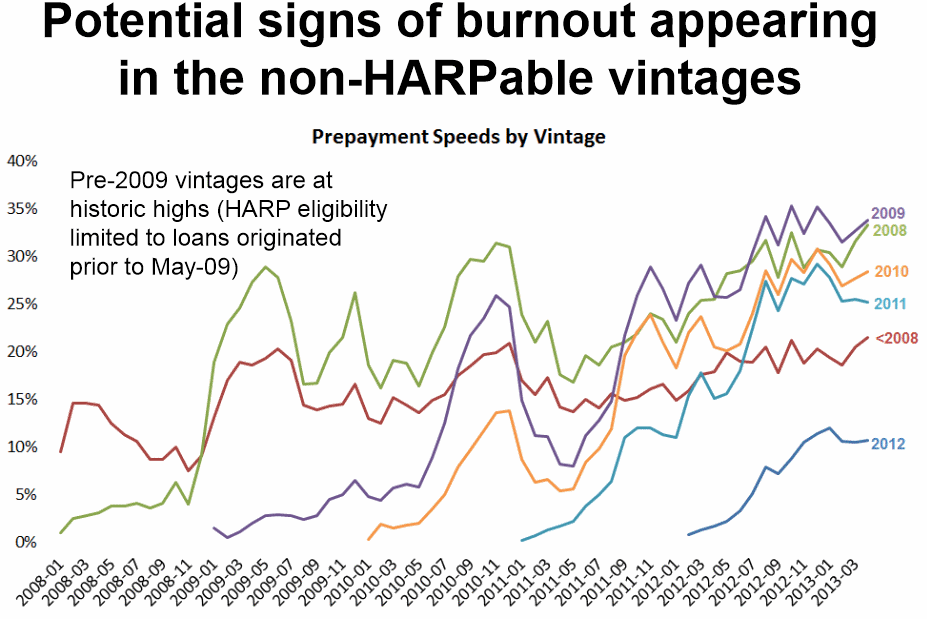
 </p<pPostrn2009 loans are showing signs of potential burnout meaning borrowersrnhave already taken maximum advantage of the current rate environment.rn The remaining loans are not eligible for HARP which is limited tornpre-2009 loans, and would not have had time to build up sufficientrnequity cushions to protect them from 2009-2012 price declines. </p
 </prn<pPrepaymentrnspeeds for lower credit borrowers have also been increasing. Borrowers with credit scores under 720 paid their loans off at a raternthat increased by 20 to 30 percent on a year-over basis compared to 7rnpercent among borrowers with scores over 720.</p<p
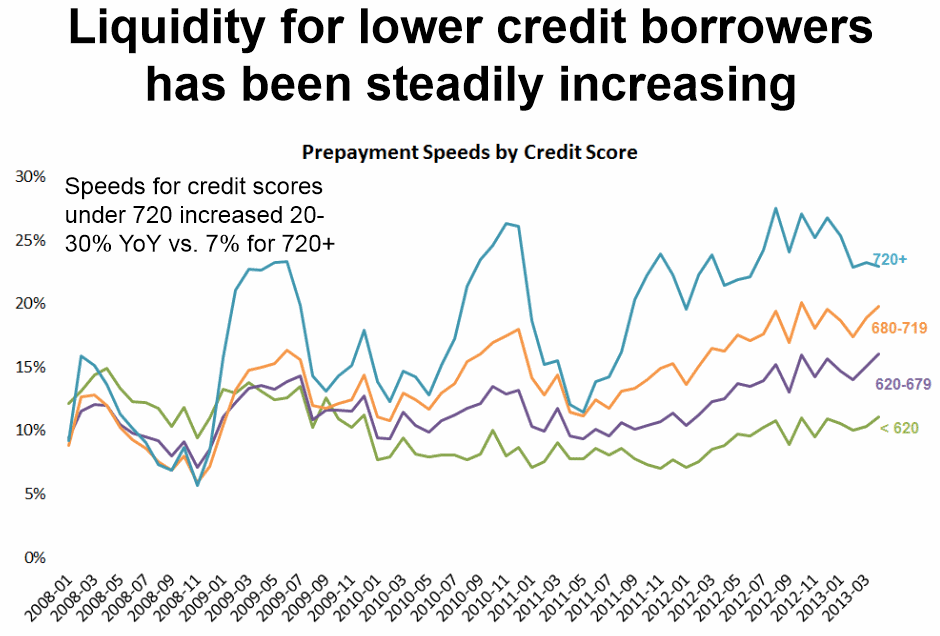 </prn<pDespiternall of the refinancing activity, LPS finds there are stillrnsignificant numbers of loans that could benefit from refinancing. About 18 percent of outstanding loans appear to have "refinanceable"rncharacteristics.</p<p
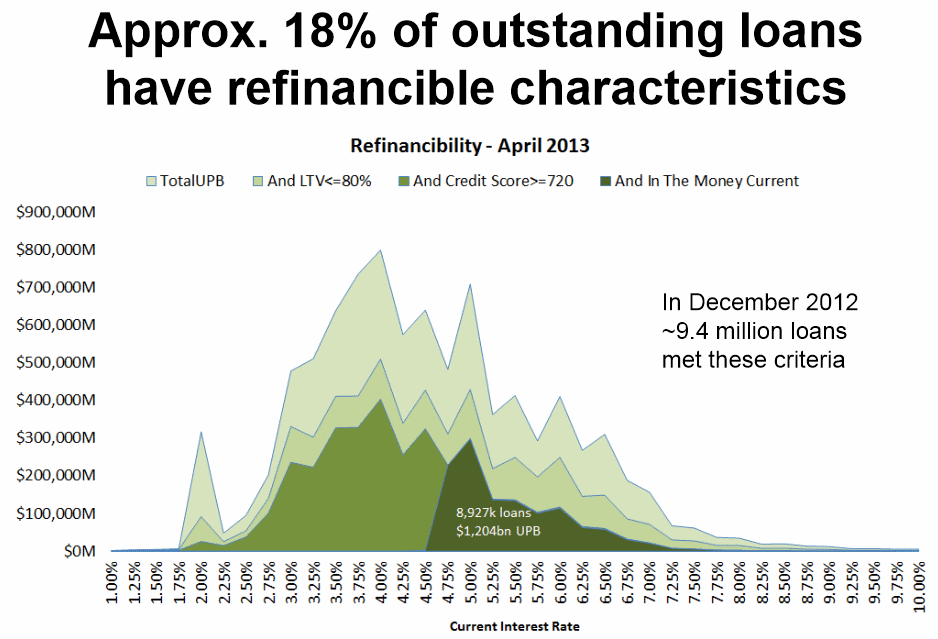 </p
</p
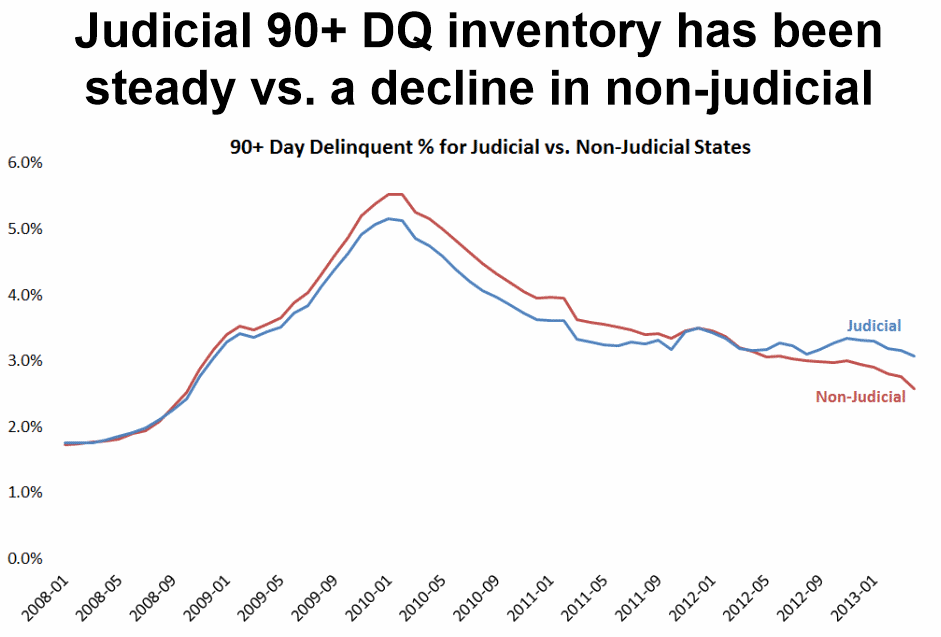
ThernMonitorrnalsornfound that the rate of foreclosure sales in judicial process statesrnhit the highest point since 2010 and their are signs that thernforeclosure inventories are beginning to decrease in those states. But the amount of time the property remains in the foreclosurerninventory continues to grow as does the disparity in timelinesrnbetween judicial and non-judicial states.</p
 </p
</p
Asrnwas reported earlier in the LPS “First Look” release lastrnmonth, the U.S. delinquency rate fel by 5.81 percent between Marchrnand April to 6.21 percent and the pre-sale foreclosure inventory raternwas down by an almost equal amount – 5.83 percent to 3.17 percent. LPS points out that the December to April seasonal decline inrndelinquencies – 13.4 percent – was the largest since 2004 and therndeterioration ratio, i.e. loans getting worse vs. better, has beenrnbelow 1.0 for 9 of the last 10 months. </p<p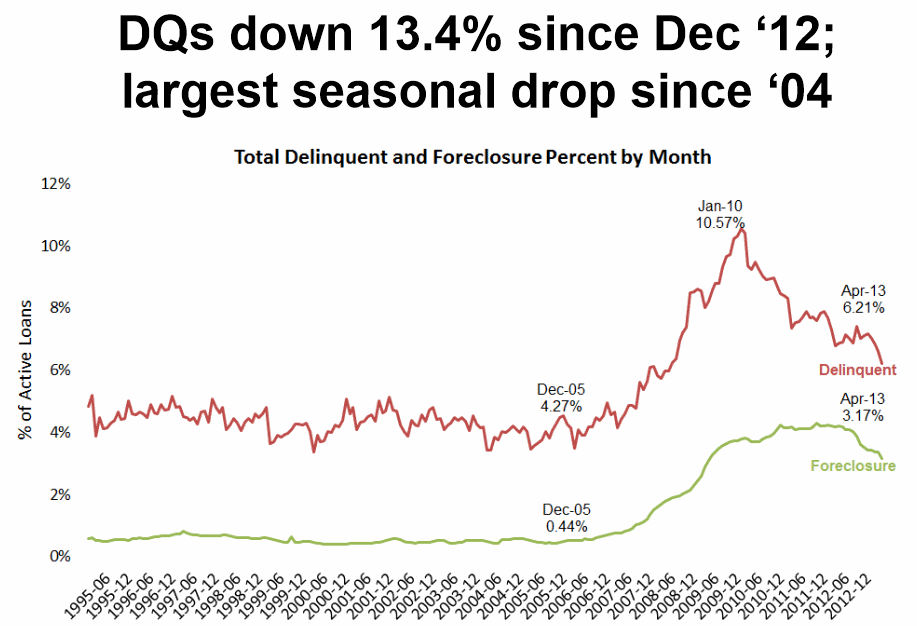 </prn<pHowever,rnwhile delinquencies are resolving, foreclosure inventories are stillrnsignificantly higher than pre-crisis across all products, in mostrncases stunningly so. </p
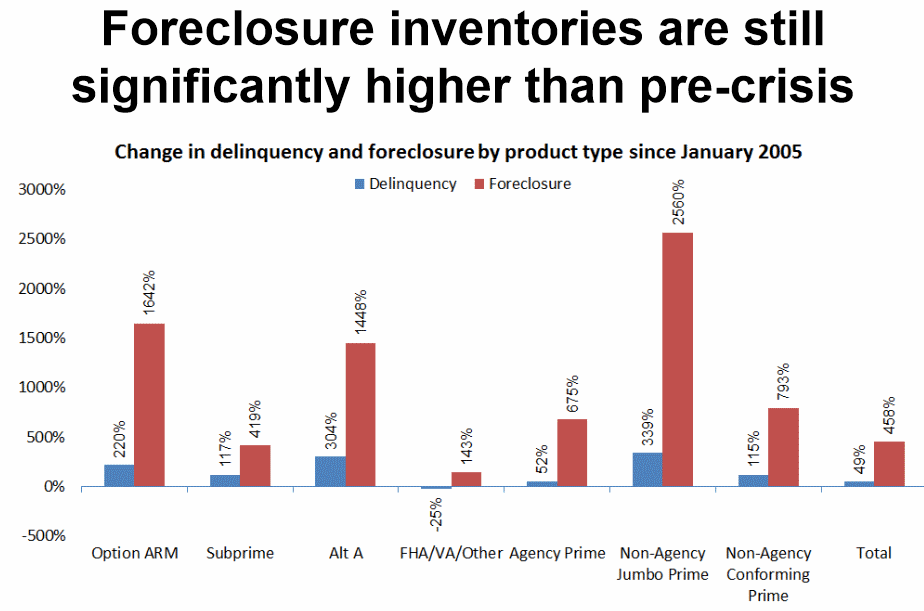
All Content Copyright © 2003 – 2009 Brown House Media, Inc. All Rights Reserved.nReproduction in any form without permission of MortgageNewsDaily.com is prohibited.
About the Author
devteam
Steven A Feinberg (@CPAsteve) of Appletree Business Services LLC, is a PASBA member accountant located in Londonderry, New Hampshire.
See all blogsLatest Articles
By John Gittelsohn August 24, 2020, 4:00 AM PDT Some of the largest real estate investors are walking away from Read More...
Late-Stage Delinquencies are SurgingAug 21 2020, 11:59AM Like the report from Black Knight earlier today, the second quarter National Delinquency Survey from the Read More...
Published by the Federal Reserve Bank of San FranciscoIt was recently published by the Federal Reserve Bank of San Francisco, which is about as official as you can Read More...
Comments
Leave a Comment