
Blog

LPS Sees "Marked Upturn" in September Delinquency Rates
LenderrnProcessing Services (LPS) notes a “marked upturn” in delinquency rates in its SeptemberrnMortgage Monitor released thisrnmorning. The company said that there isrnusually a seasonal rise in delinquencies in September, but the 7.7 percent increasernfrom the August rate is the largest monthly increase since 2008. However, Senior Vice President Herb Blecherrnsaid it is important to view the date in its proper context. </p
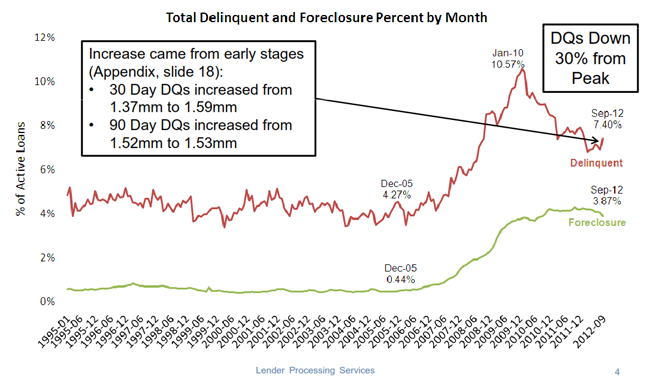
“September’srnincrease in the delinquency rate was indeed significant, but the overall trendrnis still one of improvement,” Blecher said. “Despite the monthlyrnjump, delinquencies are down 30 percent from their January 2010 peak, and ourrnanalysis revealed some interesting factors related to the spike. Of course, onernmonth’s data does not indicate a trend. We will be monitoring these factorsrnover the coming months to see how the situation develops.”<br /<br /Blecher continued, "September 2012 was notable in its short duration ofrnbusiness days and virtually all transactional or operational metrics wernobserved declined in volume for the month; foreclosure starts, foreclosurernsales, delinquent cures and loan prepayments all dropped from their Augustrnlevels. It is important to note that we also saw the percentage of re-defaultingrnmodifications contributing to the delinquency rate actually declined from thernmonth prior."</p
Therntotal national delinquency rate in September was 7.40 percent compared to 6.87rnpercent in August. Despite thernmonth-over-month spike, the September rate is down 4.2 percent from the rate inrnSeptember 2011 of 7.72 percent.</p
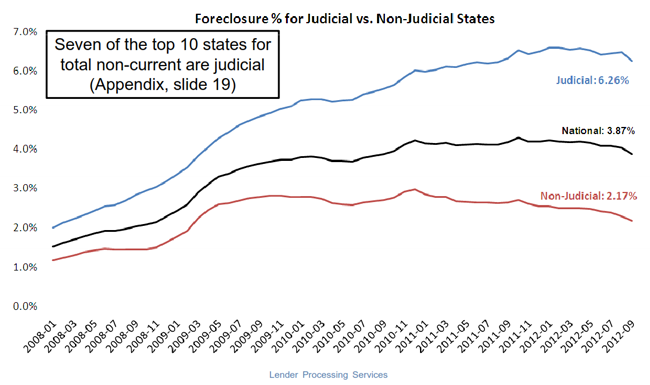
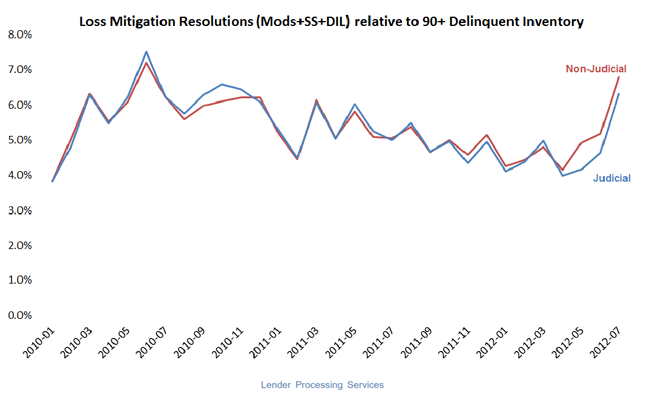
Thernpresale inventory rate in September was 3.87 percent compared to 4.04 percentrnin August and 4.18 percent the previous September. A wide disparity remains among the statesrnaccording to their foreclosure process; the foreclosure inventory is at 6.26rnpercent in states where courts are involved in foreclosures and 2.17 percent inrnnon-judicial localities. Both judicial and non-judicial states,rnhowever, seem equally focused on loss mitigation activities with littlerndifference between the two in the relative numbers of loan modifications andrnshort sales. </p
 </p
</p
 </p
</p
Foreclosurernstarts in September numbered 159,078 compared to 201,173 in August and 220,764rnin September 2011. This representsrndeclines of 20.9 percent and 27.9 percent respectively.</p
Thernstates with the highest percentage of non-current loans including bothrndelinquencies and foreclosures are Florida, Mississippi, New Jersey, Nevada,rnand Louisiana.</p
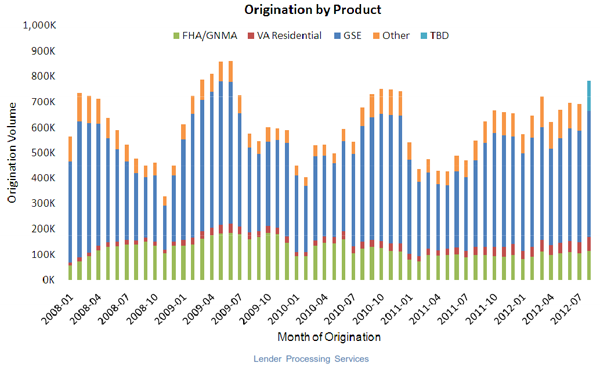
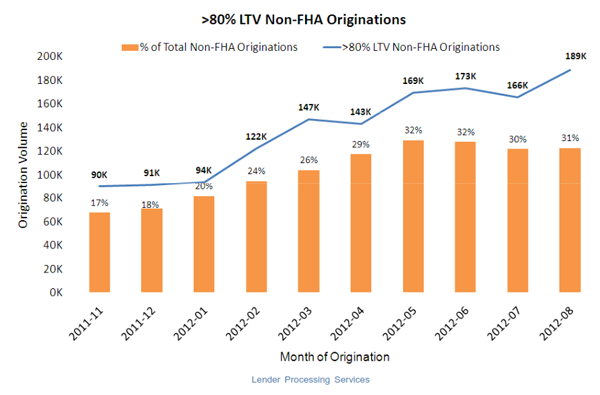
Newlyrnavailable origination data also provided additional insight into the increasernseen in August’s prepayment rates. After allowing a month for loan data to board,rnoriginations in August were found to be up 13.2 percent month-over-month andrn42.1 percent year-over-year, reaching their highest point since 2009. The datarnshows that high loan-to-value HARP originations made up nearly a quarter ofrnAugust originations.</p
 </p
</p
All Content Copyright © 2003 – 2009 Brown House Media, Inc. All Rights Reserved.nReproduction in any form without permission of MortgageNewsDaily.com is prohibited.
About the Author
devteam
Steven A Feinberg (@CPAsteve) of Appletree Business Services LLC, is a PASBA member accountant located in Londonderry, New Hampshire.
See all blogsLatest Articles
By John Gittelsohn August 24, 2020, 4:00 AM PDT Some of the largest real estate investors are walking away from Read More...
Late-Stage Delinquencies are SurgingAug 21 2020, 11:59AM Like the report from Black Knight earlier today, the second quarter National Delinquency Survey from the Read More...
Published by the Federal Reserve Bank of San FranciscoIt was recently published by the Federal Reserve Bank of San Francisco, which is about as official as you can Read More...
Comments
Leave a Comment