
Blog

MBA Notes Big Improvements in Foreclosure Starts and Delinquencies
The percentage of loans inrnforeclosure dropped 20 basis points (bps) on a seasonally adjusted basis in thernthird quarter of 2012 from the second quarter and was down 36 bps from thernthird quarter of 2011 according to the National Delinquency Survey, the resultsrnof which were released this morning by the Mortgage Bankers Associationrn(MBA). </p
The overall delinquency raternfor one-to-four family homes fell to a seasonally adjusted rate of 7.40 percent</bin the third quarter, down 18 bps from the second quarter and 59 bps from onernyear earlier. The decrease was drivenrnprimarily by a 54 basis point drop in delinquencies of 90 days or morernyear-over-year and 23 bps since last quarter. rnThe 30+ day delinquency bucket was up one basis point from last quarterrnon a seasonally adjusted basis but 29 basis point on an unadjusted basis. </p
During a conference withrnreporters following the release of the data, MBA’s Vice President of Researchrnand Economics Mike Fratantoni attributed the increase in short termrndelinquencies both to seasonality, delinquencies tend to increase from thernsecond to the third quarter, but also to the see-sawing job numbers. Short term delinquencies are frequentlyrnaffected by such fluctuations, he said, but he does not expect that rate tornrise much further absent major economic problems.</p
Foreclosure rates and thernforeclosure inventory both continue to drop. rnThe inventory rate is now at 4.07 percent, 20 bps lower than in Quarterrn2 and 36 bps below the figure one year earlier. rnForeclosure starts are at a rate of 0.90 percent, down from 0.96 percentrnin the previous quarter and 1.08 percent in Quarter 3 of 2011. Loans that are seriously delinquent or inrnforeclosure are at a rate of 7.03 percent compared to 7.31 percent in thernsecond quarter and 7.89 percent in the third quarter of 2011.</p
The combined percentage of loansrnin foreclosure or at least one payment past due was 11.71 percent on arnnon-seasonally adjusted basis, down 9 bps quarter over quarter and 92 bps fromrnthe same quarter in 2011.</p
“Mortgage delinquencies decreased compared to last quarter overall, driven mainly by a decline in loans thatrnare 90 days or more delinquent,” observed Mike Fratantoni, MBA’s Vice President of Research and Economics. “The 90 day delinquency rate is at its lowest level since 2008, and together with the decline inrnthernpercentage of loans in foreclosure, this indicates a significant drop in the shadow inventory of distressed loans-a real positive for the housing market. The 30 day delinquency rate increased slightly, but remains close to the long-term average for this metric. Given the weak economic and job growth in third quarter, it is not surprising that this metric has not improved. “</p
“The improvement in total delinquency rates was accompaniedrnby a further drop in the foreclosure startsrnrate, which hit its lowest level since 2007. Moreover, the foreclosure inventory rate decreased by 20 basis points over the quarter, the largest quarterly drop in the history of the survey. The level however, isrnstill roughly four times the long-run average for this series as we continue to see backlogs of loansrnin the foreclosure process in states with a judicial foreclosure system.”</p
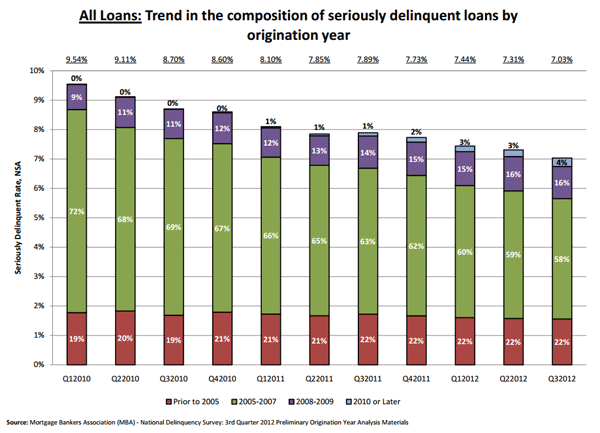
Loans originated in thern2005-2007 period continue, as they have from the beginning of the mortgagerncrisis, to make up the bulk of problem loans. rnAs seriously delinquent loans have declined from a rate of about 9.5 percentrnin the first quarter of 2010 to 7 percent in the most recent period, most ofrnthe change has been in that vintage which now represents 58 percent of thernportfolio rather than the previous 72 percent. </p
 </p
</p
Loans originated since thatrntime, with stricter underwriting and perhaps because they are starting out in arnbetter economic climate, are exhibiting a must better performance pattern.</p
 </p
</p
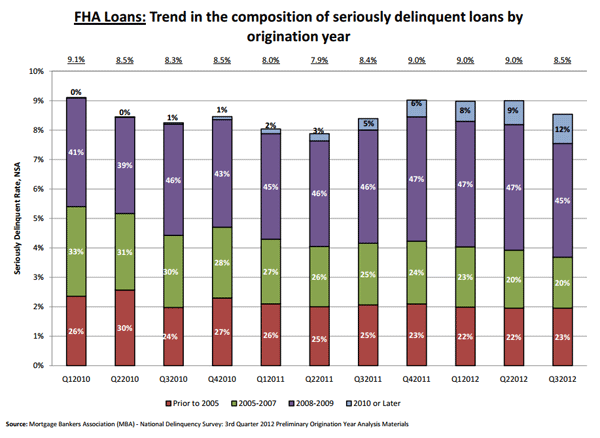
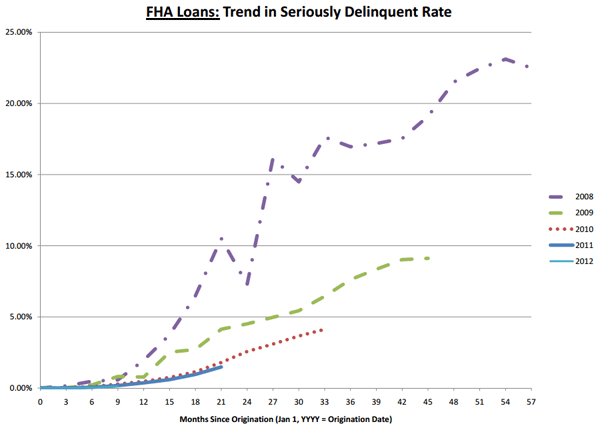
FHA loans, as Fratantoni pointedrnout, have a different profile. Whenrnprivate lending dried up in 2008 it was FHA that absorbed much of the lendingrnand it is loans originated that year which are now causing problems in thatrnportfolio. FHA also appears to haverncourse corrected and subsequent vintages are performing much better. </p
 </p
</p
 </p
</p
The number of past due loans inrnthe FHA portfolio dropped 75 bps since last quarter and are down 95 bps from arnyear earlier but are still at a rate of 11.14 percent. Fratantoni said part of this was probablyrnprocedural as servicers moved some loans they had been holding back intornforeclosure but some of the improvement probably reflects FHAs improving creditrnprofile. In response to a reporter’srnquestion, however, he declined to speculate whether the worst was over for thernagency.</p
Fratantoni pointed to both thernrapid drop in problem loans in several states that had suffered more than mostrnduring the foreclosure crisis. While thernpercentage of loans in foreclosure have dropped 20 bps on a quarterly basisrnnationally, in California they were down 44 bps, in Mississippi 50, Arizona 73,rnand Florida 66. </p
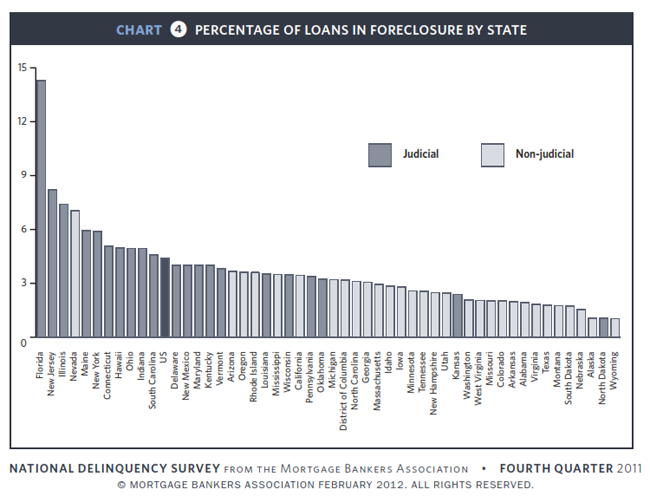
There is still a largerndiscrepancy between foreclosure rates in judicial and non-judicial states. The rate decreased slightly in judicialrnstates to 6.6 percent but more sharply in non-judicial states to 2.4rnpercent. MBA said the difference in thernrates of the two regimes is at its widest since it started tracking in it 2006.</p
Fratantoni said, “If states delay initiating the foreclosure process, the 90 day delinquency rate goes up as new foreclosures are not initiated and these loans are held in the 90 day delinquency category. If the foreclosure process itself is slowed, the inventory rate goes up as the foreclosure timeline is extendedrnand more loans are being held in foreclosure. The rate of new foreclosures started changes when procedures change. The foreclosure rates in Maryland, Washingtonrnand New Jersey continue to bernimpacted by state efforts to slow the foreclosure process and by servicers who have to adjust their internal foreclosure processes based on state requirements. As a result, these states often fluctuaternbetween large increases in foreclosure starts accompanied by large decreases in 90 day delinquencies inrna single quarter, or large increases in 90 day delinquencies accompanied by large decreases in newrnforeclosures started. This quarter, Maryland and Washington saw large decreases in new foreclosures started after significant increases last quarter. New Jersey led the increases in foreclosures started acrossrnevery loan type, while seeing almost equally large decreases in loans that were 90 daysrndelinquent.”
Fratantoni said that looking forward MBA expects to see continued growth in jobs and continued and even accelerating improvements in the housing market. While foreclosures will continue to work through the system, a more robust housing market will help improve the delinquency picture.
All Content Copyright © 2003 – 2009 Brown House Media, Inc. All Rights Reserved.nReproduction in any form without permission of MortgageNewsDaily.com is prohibited.
About the Author
devteam
Steven A Feinberg (@CPAsteve) of Appletree Business Services LLC, is a PASBA member accountant located in Londonderry, New Hampshire.
See all blogsLatest Articles
By John Gittelsohn August 24, 2020, 4:00 AM PDT Some of the largest real estate investors are walking away from Read More...
Late-Stage Delinquencies are SurgingAug 21 2020, 11:59AM Like the report from Black Knight earlier today, the second quarter National Delinquency Survey from the Read More...
Published by the Federal Reserve Bank of San FranciscoIt was recently published by the Federal Reserve Bank of San Francisco, which is about as official as you can Read More...
Comments
Leave a Comment