
Blog

Mortgage Monitor Shows Reversal in Strong Q1 Refi Demand
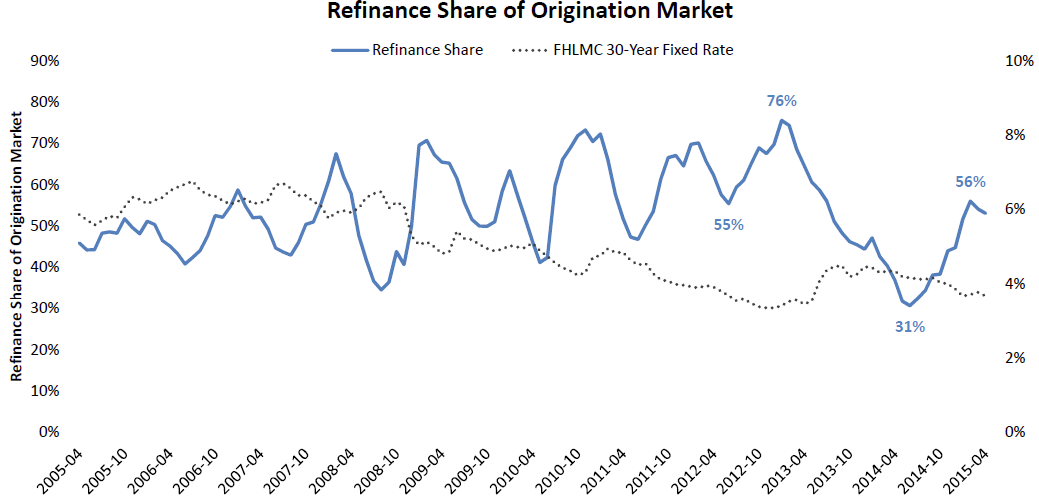
While the trend will likely continue to reverse in the next few reports, refinancing, as a share of total originations, made an impressive recovery through the first quarter of 2015 after falling off the pace inrn2014. Black Knight’s April MortgagernMonitor reports that, while the refinancing share dropped back slightly in April,rnrefinancing accounted for over 50 percent of originations, hitting a high of 56rnpercent at one point in the quarter. </p
 </p
</p
The reasonrnfor this was of course an unexpected drop in interest rates, down 70 basisrnpoints from a year earlier, providing what the Monitor describes as a “veryrninterest rate sensitive population” with an additional incentive tornrefinance. Black Knight estimates there are now about 7rnmillion potential refinance candidates compared to 4.5 million a year ago but arn50 basis point increase in rates would result in a 43 percent reduction inrnrefinance candidates – approximately 3 million borrowers.</p
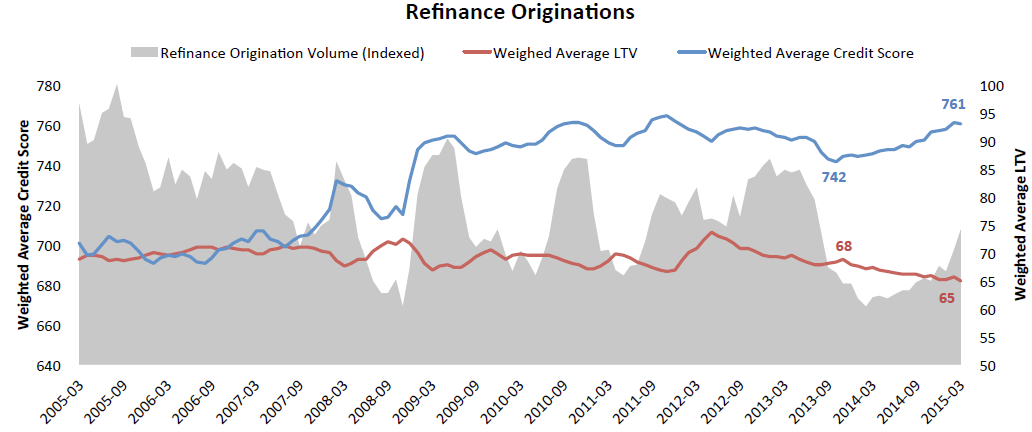
While therninterest rate climate was encouraging refinancing, the Monitor reports thatrnstandards for doing so have been tightening. rnAverage loan-to-value ratios are dropping and average credit scores arernrising. Over the past 18 months creditrnscores on refinance originations have increased 19 points to a weighted averagernof 762 while LTVs have dropped to 65 percent.</p
 </p
</p
The percentagernof refinance originations for borrowers with credit scores over 740 has risenrnfrom 55 percent in the first quarter of 2014 to 68 percent in the same quarterrnof 2015 while those with credit scores under 640 which had accounted for 6rnpercent of originations in that earlier period have since dropped back to onlyrn3 percent. Borrowers in the middle -rnscores between 680 and 739 – have lost ground as well, dropping from 28 percentrnof refinance originations in Q1 of 2014 to 23 percent in the most recentrnquarter.</p
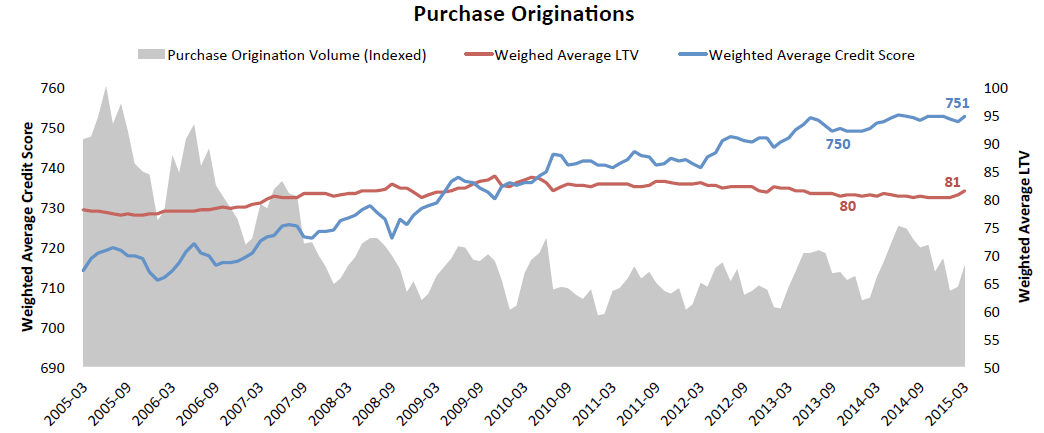
Lending requirementsrnremain tight for purchasing as well. Thernweighted average credit score in the first quarter of this year was 751 and thernLTV was 81 percent, both marginally higher than a year earlier. </p
 </p
</p
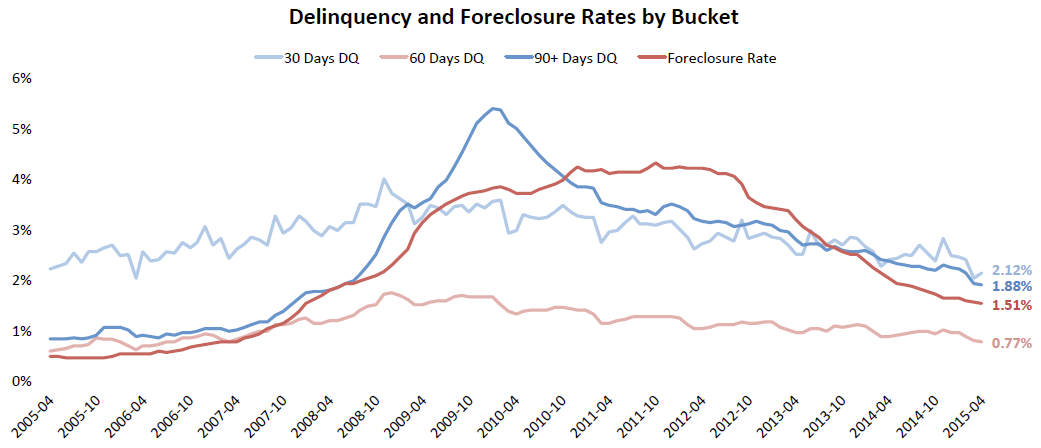
The Monitor’s data on delinquencies and foreclosures showedrna slight seasonal 1.46 percent uptick in the former to a national rate of 4.77rnpercent. Foreclosure starts were down 22rnpercent for the month and 7 percent year-over-year, and the foreclosurerninventory fell by 18,000 properties to 764,000, down a quarter million from thernsame period in 2014.</p
Thirty-day delinquencies are were down 11 percent year-over-yearrnand are now below pre-crisis rates at 2.12 percent. Sixty-day delinquencies, at 0.77 percent arernjust slightly above pre-crisis norms. rnDelinquencies of 90 days or more remain at double pre-crisis levels ofrn.88 percent at 1.9 percent but significantly lower than at the peak of 5.4rnpercent in January 2010.</p
 </p
</p
Among loans that are both seriously delinquentrnand in foreclosure, an estimated 1.7 million, 480,000 or 28 percent are locatedrnin Florida, New York, or New Jersey and the states represent three out of the top five for this metricrn(Mississippi and Main are number three and four by percentage). They are the top three by volume.</p
Black Knight Data & AnalyticsrnSenior Vice President Ben Graboske said, “Of these three states, Florida hasrnseen the most improvement, with a 37 percent decline in inventory over the lastrnyear, and a 63 percent drop over the last two years. On the other hand, low foreclosure completionrnrates in New York and New Jersey have contributed to lingering inventory inrnthose states. Looking at pipeline ratios – the length of time it would take tornwork through the backlog at the current rate of foreclosure completions – wernsee New York and New Jersey with nearly 13 and nine years of inventory,rnrespectively. Even though Florida peaked with 20 percent of the entire staternbeing 90 or more days past due, its pipeline ratio was never longer than 10rnyears and is currently the lowest among all the judicial foreclosure states atrnjust under three years. Compare that to Washington, D.C., which uses arnnon-judicial foreclosure process and a comparatively very small backlogrninventory, yet still has a pipeline of over 43 years, primarily due tornextremely low foreclosure sales volume there.”</p
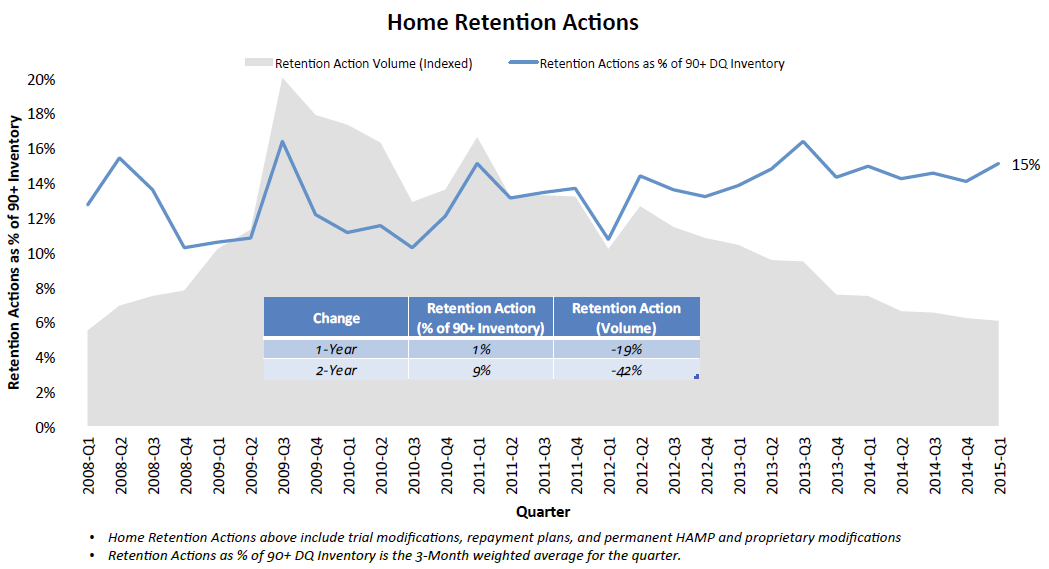
Black Knight estimates there are now approximately 952,000rnseriously delinquent loans that are not yet in foreclosure. The April Monitor looks at the history ofrnthose loans vis-à-vis actions taken to prevent foreclosure. </p
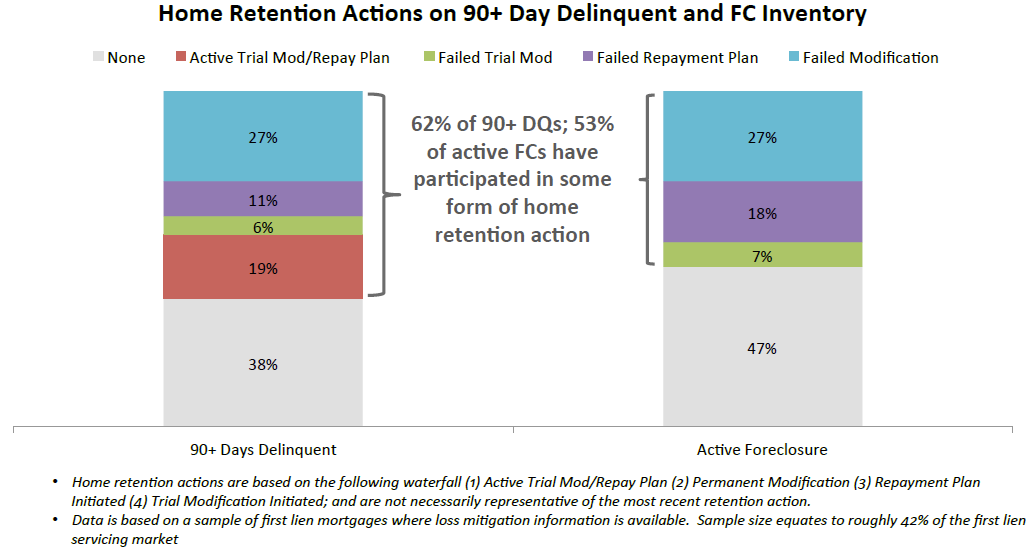
The number of foreclosure modifications and other retentionrnactions completed by servicers has fallen by 42 percent over the last twornyears. Retention actions include trial modifications, repayment plans, andrnpermanent HAMP and proprietary modifications. At the same time the percentage of delinquentrnloans that have been modified at least once continues to rise. Sixty-two percent of the seriously delinquentrnloans, have undergone one or more retention action, a 9 percent increase overrnthe last two years. </p
This finding is not surprising. As delinquencies continue to shrink, eitherrnas loans are brought current, homes are sold by their owners, or are liquidatedrnthrough foreclosure, those loans that have been most resistant to remediationrnremain.</p
Further, the report says that 70 percent of new trialrnmodifications or payment plans are repeat actions. Looking back to 2011, only about 45 percentrnof trials and repayment plans were repeat actions</p
“In analyzing the data around homernretention initiatives, we found that nearly one in five seriously delinquentrnborrowers are currently taking part in an active trial modification or paymentrnplan,” Graboske said. “With 62 percentrnof loans 90 or more days delinquent but not yet in foreclosure having beenrnthrough some form of home retention action, we’re currently seeing the highestrnlevel of saturation yet, but that’s only marginally up from last year – inrnother words, that saturation level is beginning to flatten. Overall, homernretention actions have declined 42 percent over the past two years, but at thernsame time have increased nine percent as a share of that seriously delinquentrninventory. We’re also starting to see some redundancy in this activity – 70 percentrnof all new trial modifications and repayment plans have already been throughrnone or more home retention actions previously.”</p
 </p
</p
Looking at this home retention data onrna geographic level, Washington, D.C., led the nation with 67 percent of itsrnseriously delinquent inventory having gone through some sort of home retentionrnactivity; of these, 26 percent are currently in an active trial modification orrnrepayment plan. Maryland, Georgia, Texas and Connecticut followed; all with 66rnpercent of seriously delinquent loans having a history of home retentionrnaction. Among loans in activernforeclosure about 53 percent had taken part in home retention initiatives.</p
All Content Copyright © 2003 – 2009 Brown House Media, Inc. All Rights Reserved.nReproduction in any form without permission of MortgageNewsDaily.com is prohibited.
About the Author
devteam
Steven A Feinberg (@CPAsteve) of Appletree Business Services LLC, is a PASBA member accountant located in Londonderry, New Hampshire.
See all blogsLatest Articles
By John Gittelsohn August 24, 2020, 4:00 AM PDT Some of the largest real estate investors are walking away from Read More...
Late-Stage Delinquencies are SurgingAug 21 2020, 11:59AM Like the report from Black Knight earlier today, the second quarter National Delinquency Survey from the Read More...
Published by the Federal Reserve Bank of San FranciscoIt was recently published by the Federal Reserve Bank of San Francisco, which is about as official as you can Read More...
Comments
Leave a Comment