
Blog

New Fed Data Reveals More About How Treasuries Stack up
Michael Fleming, Vice President, Research and Statistics Group of thernFederal Reserve Bank of New York (FRBNY) recently provided a tutorial on thernbank’s blog, Liberty Street Economics</ion how to interpret and use new data on primary dealer activity. His article addresses the changes recentlyrnmade to the way in which the data is collected, aggregated, and presented tornthe public. </p
Byrnway of background, FRBNY has long collected market information from its primaryrndealer trading counterparts but until last April the data was only availablernfor broad categories of securities rather than specific ones. Primary dealers are expected to provide datarnthrough a FR 2004 statistics reports which collect mostly weekly information onrndealers’ transactions, positions, financing, and settlement activities in U.S.rnsecurities, including agency debt, mortgage and asset-backed, corporate debt, andrnmunicipal securities. Most informationrnis requested for broad categories of securities, although some is requested forrnspecific Treasury security issues.</p
Therndata is collected on Wednesday, aggregated across dealers and released by the Fedrna week later. The aggregated data havernbeen analyzed in numerous studies and the transaction data in particular arernwidely cited as a gauge of market activity, and allow each reporting dealer torngain a sense of its market share in various products.</p
In April the Fed began releasing aggregated primaryrndealer data on specific Treasury issues. rnIn particular, the data cover dealerrnactivity in the most recently issued notes and bonds, including both nominalrnsecurities and Treasury inflation-protected securities; specific issue data arernnot collected for bills. This allows, Fleming says, for a more refinedrnunderstanding of market conditions and dealer behavior. </p
Usingrncharts for illustration, Fleming presented examples of the newly released data andrnhow it can be useful. The chart below plotsrntransaction data for the nominal notes and bonds. It shows that the nominalrnfive- and ten-year notes are the single most active Treasury securities, withrndaily activity recently averaging about $100 billion each.</p
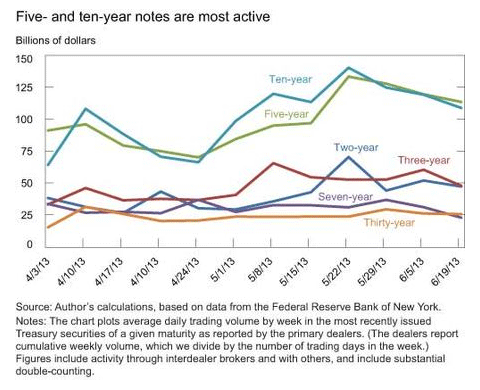 <br /<br /While these six issues represent a tiny fraction of some 300 nominal Treasuryrnsecurities outstanding, one can infer from the chart (and referring tornnon-issue specific data) that they account for about 62 percent of all nominalrnsecurities trading. Fleming said this illustratesrnthe widely known phenomenon of activity concentrating in the most recently soldrnsecurities (on-the-run securities), dropping sharply in older securities whenrnnew ones are auctioned. This highrnconcentration of trading in the on-the-run securities makes the issuesrnespecially liquid, allowing market participants to transact in large size withrnminimal price impact.</p
Byrnlooking at data for all (non-issue specific) trading through interdealerrnbrokers one can see that the specific issues account for about 71 percent ofrnall security trading through those dealers but only 55 percent of trading donernthrough others. This is consistent withrnthe idea that the dealers rely highly on the liquidity of the on-the-runrnsecurities to transfer interest rate risk among themselves.</p<pFrom the next chart one can see that dealersrnhave recently been long on Treasuries in general but short on these specificrnissues, perhaps because of dealers' practice of hedging positions in otherrninstruments with on-the-run securities. Thisrnpast spring, the largest net short position of dealers was in the ten-yearrnnote, with their aggregate net short position as large as $22 billion inrnmagnitude.<br /<br /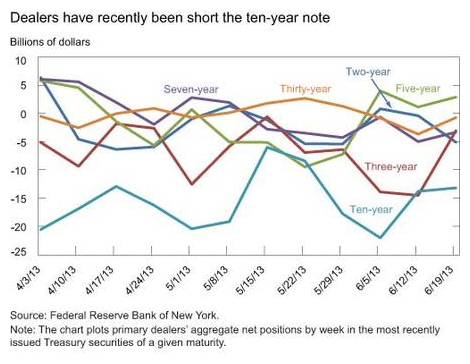 <br /<br /Fleming's final chart plots dealers’ failures to deliver specific nominalrnTreasury issues. Generally speaking,rnfails tend to increase when issues get expensive to borrow and this happensrnwhen there is either a high borrowing demand or low lendable supply. The chart shows a large spike in settlementrnfails in the ten-year note, starting in the week ending June 5 and ending inrnthe week ending June 19, mirroring the maximum period of short positions inrnthose securities. While the dealer datarnaren’t comprehensive, they’re suggestive of a large short base in the ten-yearrnnote and of the resulting high borrowing demand leading to a high level ofrnfails.<br /<br /
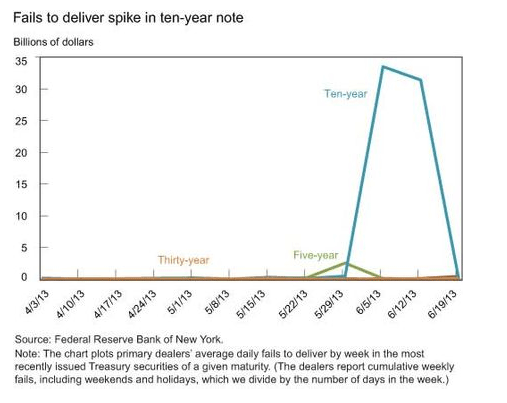 <br /<br /The decline in fails in the week ending June 19, in contrast, is likelyrnattributable to supply considerations. Current Treasury policy is to issue arnnew ten-year nominal note every three months, but to sell additional quantitiesrnof the on-the-run note one and two months after its original issuance. ThernTreasury thus issued $24 billion of a new ten-year note on May 15 and anrnadditional $21 billion of the note on June 17. The additional issuancernincreased lendable supply, thereby easing the settlement disruptions in thernnote.<br /<br /Fleming says his review is merely intended to give a flavor of the new data andrnhow it can be used. Its benefits arernlikely to grow over time as a history develops with which the data can bernanalyzed more fully.
All Content Copyright © 2003 – 2009 Brown House Media, Inc. All Rights Reserved.nReproduction in any form without permission of MortgageNewsDaily.com is prohibited.
About the Author
devteam
Steven A Feinberg (@CPAsteve) of Appletree Business Services LLC, is a PASBA member accountant located in Londonderry, New Hampshire.
See all blogsLatest Articles
By John Gittelsohn August 24, 2020, 4:00 AM PDT Some of the largest real estate investors are walking away from Read More...
Late-Stage Delinquencies are SurgingAug 21 2020, 11:59AM Like the report from Black Knight earlier today, the second quarter National Delinquency Survey from the Read More...
Published by the Federal Reserve Bank of San FranciscoIt was recently published by the Federal Reserve Bank of San Francisco, which is about as official as you can Read More...
Comments
Leave a Comment