
Blog

New Home Sales Stuck Near Record Low Levels
The Census Bureau and the Department of Housing and Urban Development today released New Residential Home Sales survey data for December 2009.
The survey is primarily based on a sample of houses selected from building permits. Since a “sale” is defined as a deposit taken or sales agreement signed, this can occur prior to a permit being issued. Changes in sales price data reflect changes in the distribution of houses by region, size, etc., as well as changes in the prices of houses with identical characteristics. It takes four months to establish a trend of new home purchases
PREVIOUS REPORT: NOVEMBER SURVEY DATA
Sales of new single family homes fell 11.3% to an annual pace of 355,000 units. This was much lower than consensus estimates of 440,000 annual sales and 45,000 less than the October print of 400,000, which was REVISED FOR THE WORSE from 430,000. This was the slowest pace of new home sales in 7 months and the worst month over month decline since January 2009.
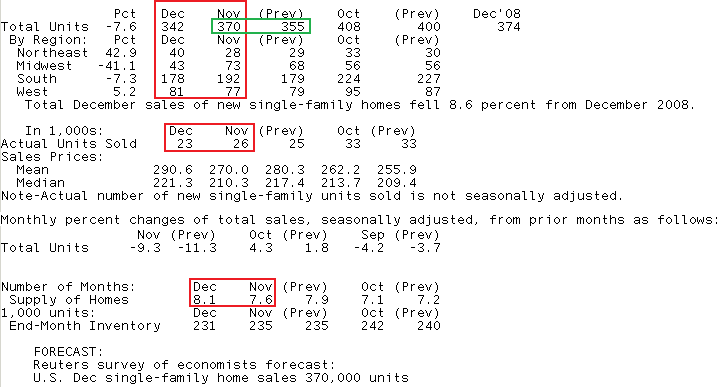
CURRENT RELEASE: DECEMBER SURVEY DATA
Consensus Estimate: 370,000 annual sales
Result: -7.6% to 342,000 annual sales. Worse than Expected
Sales of new one-family houses in December 2009 were at a seasonally adjusted annual rate of 342,000. This is 7.6% below the revised for the better November rate of 370,000 and is 8.6% below the
December 2008 estimate of 374,000.
The median sales price of new houses sold in December 2009 was $221,300, an increase of $11,000. The average sales price was $290,600, an increase of $20,600!!! When trying to rationalize the increase in prices vs. the fall in sales, one has to assume this was a factor of who was buying a home in December. First time home buyers generally go for the bargains whereas upgrade buyers are looking to UPGRADE (:-D) to a larger, more expensive home. So it is likely that less FTHBs were buying new homes in December.
The seasonally adjusted estimate of new houses for sale at the endrnof December was 231,000. This represents a supply of 8.1 months at therncurrent sales rate.
An estimated 374,000 new homes were sold in 2009. This is 22.9% below the 2008 figure of 485,000 and a record low for annual new homes sales.
Here is a table summarizing the data:
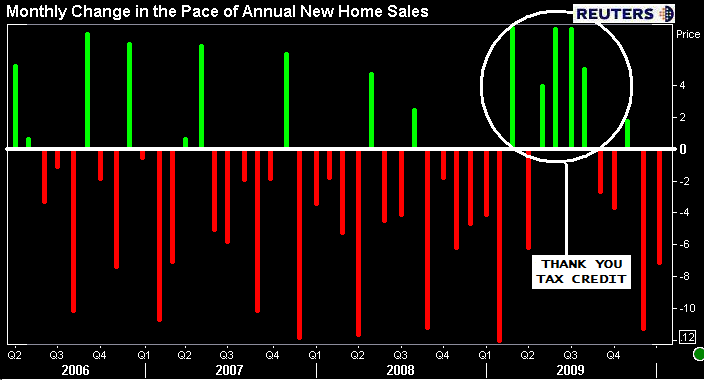
Below is a chart of recent month over month changes in the pace of annual New Home Sales. Notice the increase of activity over Q2 and Q3 2009, this was a function of the first time home buyer tax credit incentive and a the normal seasonal pick up in buyer demand. More recently, new home sales have slowed. While this is likely due to normal seasonal slowness and the expiration of the FTHB tax credit (now extended), I must point out that this data is already seasonally adjusted. So clearly one of two things are occuring, structural weakness is still significant in housing demand OR seasonal adjustment metrics need to be adjusted. The former seems more likely. Keep reading…
I used the above chart to call attention to the housing market's inability gain stable traction. To avoid distorting perceptions of economic reality, I should further clarify. Below is a chart of the annual pace of new home sales, seasonally adjusted. My goal in using the chart below is to point out structural weakness in the housing market. Look where current sales levels are compared to recent months and years: STUCK NEAR RECORD LOW LEVELS OF ACTIVITY
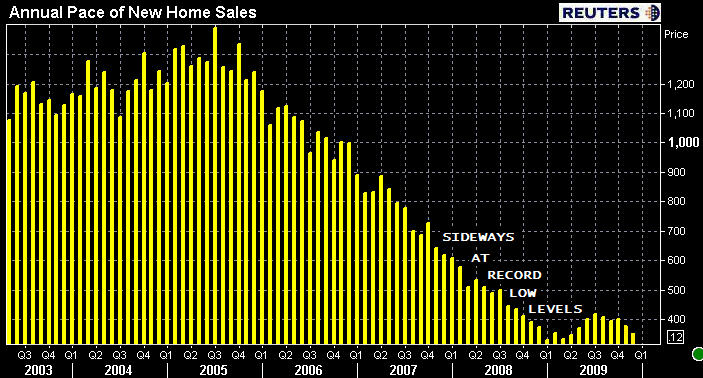
While large percentage gains and contractions have been noted inrnhousing data lately, I think it is very important to remind that thernperception of drastic improvement and dramatic contraction is morernlikely to occur when the market is rebounding off of record low levelsrnof activity. When you improve from 1 unit in sales to 2 units in sales,rntotal sales increase by 100%. The above month over month changes arernvery similar. Instead of looking at month over month data, look forrnlonger trends. In the chart below you can see that New Home Sales arerntrending sideways near record low levels. This is going to be a slowrnrecovery process. I wrote on the impact that home builders may have on this recovery: READ MORE ON THE OUTLOOK FOR HOUSING
All Content Copyright © 2003 – 2009 Brown House Media, Inc. All Rights Reserved.nReproduction in any form without permission of MortgageNewsDaily.com is prohibited.
About the Author
devteam
Steven A Feinberg (@CPAsteve) of Appletree Business Services LLC, is a PASBA member accountant located in Londonderry, New Hampshire.
See all blogsLatest Articles
By John Gittelsohn August 24, 2020, 4:00 AM PDT Some of the largest real estate investors are walking away from Read More...
Late-Stage Delinquencies are SurgingAug 21 2020, 11:59AM Like the report from Black Knight earlier today, the second quarter National Delinquency Survey from the Read More...
Published by the Federal Reserve Bank of San FranciscoIt was recently published by the Federal Reserve Bank of San Francisco, which is about as official as you can Read More...
Comments
Leave a Comment