
Blog

New Indicator says Housing is Healthy, Downturn unlikely
Nationwide said on Tuesday that the overall housing marketrnis healthier than at any time since 2001, the earliest point for which data isrnavailable and that data suggests there is little reason to fear a nationalrnhousing downturn over the next year. </p
The insurance and financial services organization unveiled arnnew housing market indicator, the Leading Index of Health Housing Marketsrn(LIHHM). The indicator’s national scorernas well as regional readings and breakdowns will be released quarterly in Nationwide’s Health of Housing Markets (HoHM)rnReport. (As an aside, we wonder if anyone at Nationwide ever pronounced thatrnacronym aloud.) </p
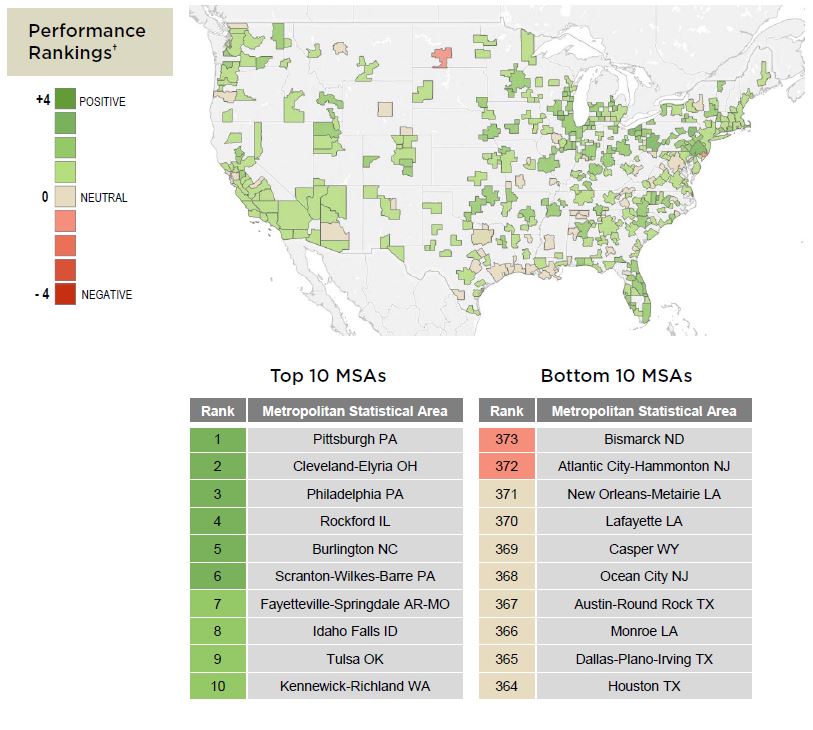
Nationwide calls the LIHHM “a data-driven view of thernnear-term performance of housing markets based upon current health indicatorsrnfor the national housing market and 373 metropolitan statistical areas (MSAs).” The company says the index focuses on thernentire housing market rather than merely projecting house prices or home sales.rn</p
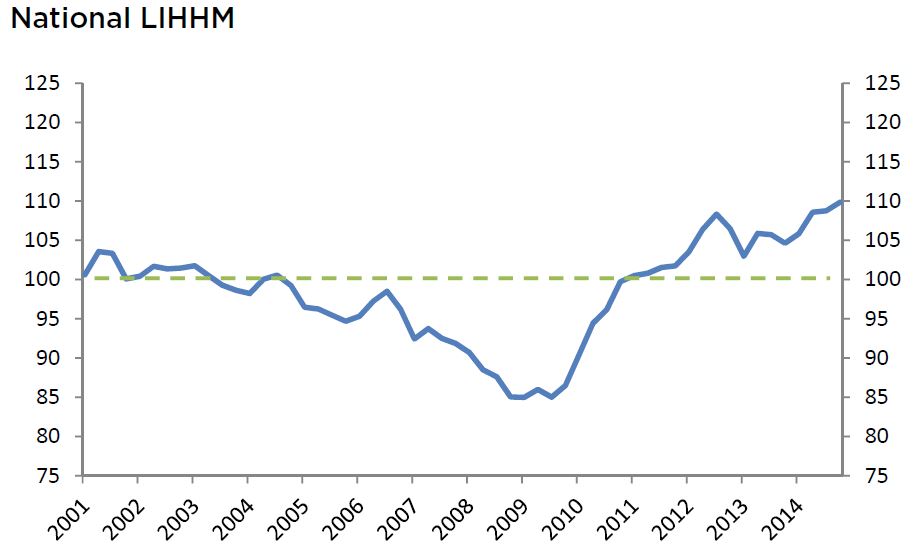
The indicator is calculated using local level data in fourrncategories, employment, demographics, mortgage market, and house prices and hasrna range of 75 to 125 with 100 being a neutral value. Values are placed into performance rankingsrn(+3, -1) to allow for better comparisons across MSAs; the raw values will bernused only on the national level as it is not compared to other areas. </p
Fourth quarter 2014 data was used torndetermine the index level. In the latest period, household formations rose at arnfaster pace, but a continued tight mortgage-lending environment persists as anrnimpediment to even stronger national housing activity.</p
Specifically, the inaugural HoHM Report finds that the currentrnleading indicator score is 109.8, a modest increase from the 108.7 score forrnthe fourth quarter of 2014 and the highest level since 2001. An index value over 100 suggests the nationalrnhousing market is healthy, with lower chances of a housing downturn over thernnext year as the index moves increasingly above the 100 breakeven value.</p
 </p
</p
Nearly all of the MSA’s are healthy withrnsix scoring a +3 (very healthy) rating and 100 having a +2 rank. That means that few regional markets arernvulnerable to housing downturns in the short term. The healthiest markets were found in Pittsburgh,rnCleveland, and Philadelphia but all of the largest 40 MSAs were in positivernterritory and only six were neutral. Thernrankings were generally highest in the Midwest and Northeast, indicating thatrnthese are the regions that are least likely to have a near-term downturn.</p
 </p
</p
Of the bottom 10 (which include many ofrnthe high-flying energy areas such a New Orleans, Houston, and Dallas) only two,rnBismarck and Atlantic City, were in negative territory which, the report says,rnsuggests that even the bottom 10 isn’t all that bad today. </p
About 25 percent of markets worsenedrnover the past year while 29 percent improved. rnThis, however was the smallest percentage with increasing values sincern2009. Cities with the largest decreasesrnwere Bismarck, Bellingham, Washington; Roanoke, Bloomington, and Atlantic City.rnRegionally decreases were more prevalent in the South Atlantic and Gulf Coastrnareas. </p
The most improved City was Elmira, NewrnYork, followed by Ithaca, Erie, Decatur, Illinois; and Johnstown,rnPennsylvania. Regionally there were pocketsrnof increases centered in the Midwest and Northeast, the two regions asrnmentioned above that were strongest overall. </p
To validate the efficacy of its new indicatorrnNationwide showed how it would have performed prior to both the housing bustrnand its recovery. Even though housing prices did not peak untilrn2006, the LIHHM fell below 100 early in 2005 and by the fourth quarter of thatrnyear the vast majority of MSAs did so as well. This suggests that the national and almost allrnregional housing markets were not healthy and that a housing downturn wasrnlikely.</p
Following the housing bust and recessionrnthere was no rebound in home sales until the second half of 2011 and prices didrnnot start to recover until 2012. Howeverrnby the end of 2010 the LIHHM performance rankings turned positive or neutral inrntwo-thirds of the regional markets and the national index crept above 100 by thernstart of 2011. This indicates a slightlyrnbetter housing market and presages the current housing recovery. </p
“Unlikernmost other housing indices or surveys, the HoHM Report provides a look into thernfuture instead of the rearview mirror,” said David Berson, Nationwide’s chiefrneconomist and senior vice president. “The quarterly report should serve as arnresource to gauge how healthy housing markets are today but, perhaps more important,rnwhat to expect in the future and why.”
All Content Copyright © 2003 – 2009 Brown House Media, Inc. All Rights Reserved.nReproduction in any form without permission of MortgageNewsDaily.com is prohibited.
About the Author
devteam
Steven A Feinberg (@CPAsteve) of Appletree Business Services LLC, is a PASBA member accountant located in Londonderry, New Hampshire.
See all blogsLatest Articles
By John Gittelsohn August 24, 2020, 4:00 AM PDT Some of the largest real estate investors are walking away from Read More...
Late-Stage Delinquencies are SurgingAug 21 2020, 11:59AM Like the report from Black Knight earlier today, the second quarter National Delinquency Survey from the Read More...
Published by the Federal Reserve Bank of San FranciscoIt was recently published by the Federal Reserve Bank of San Francisco, which is about as official as you can Read More...
Comments
Leave a Comment