
Blog

RealtyTrac Analysis points to Millennial-Friendly Markets
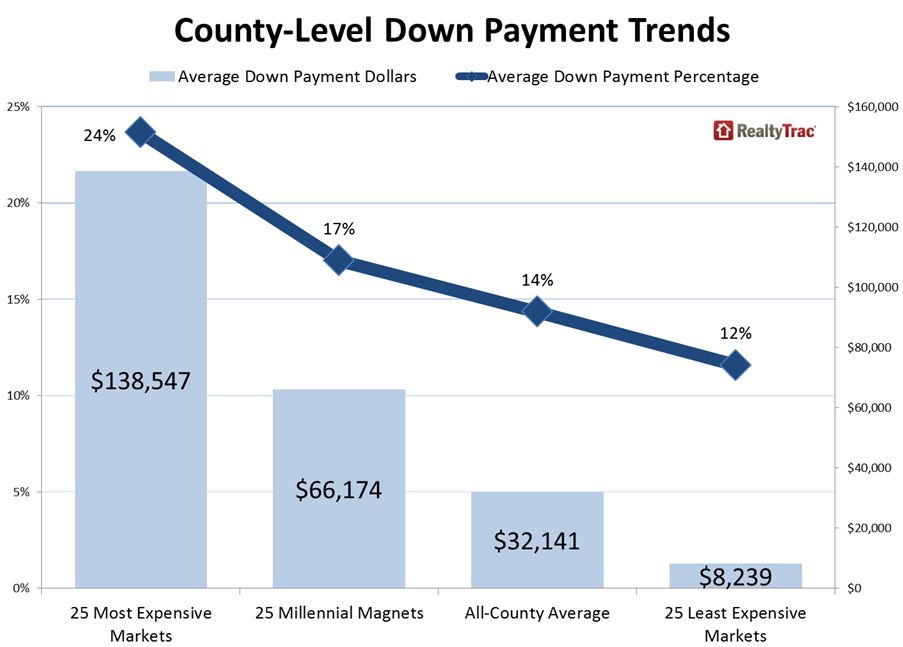
Itrnseems counterintuitive, but RealtyTrac said today that persons purchasing homesrnin the highest priced communities in the US last year made significantly higherrndown payments on a percentage basis than did those purchasing in the leastrnexpensive communities – twice as large as a matter of fact. In the 25 least costly count-ies in the U.S.rnthe average down payment on a single-family or condominium purchase was 24rnpercent in 2014 as opposed to 12 percent in the 25 least expensive counties. This number becomes even more surprising whenrnthose percentages are translated into dollars; an average of $138,547 versusrn$8,239. </p
Thernnational average for down payments last year across the 386 counties in whichrnRealtyTrac analyzed purchase loan and sales date was 14 percent or an averagernof $32,141. The study included data onrn1.5 million home purchases.</p
Among the 25 costliest counties whatrnwere considered to be low down payment loans accounted for an average of only 7rnpercent of all home purchases while in the 25 least expensive counties 25rnpercent of homes were purchased using low down payments. </p
 </p
</p
The highest average down payments inrndollars were all found in New York and Northern California. In New York County where the median homernprice was $935,000 the average down payment was 37.18 percent or $347,614. San Francisco County had a higher median butrnlower down payment, an average of $305,467 or 30.01 percent. San Mateo County was third with an average ofrn$254,779 down or 28.46 percent followed by Kings County in the New Yorkrnmetropolitan area at 28.20 percent and Marin County, also part of the SanrnFrancisco MSA at 27.81 percent.</p
At the other end of the scale were tworncounties in Michigan, Genesee which includes the city of Flint and Muskegon whererndown payments were 8.98 percent ($6,283) and 9.53 percent ($7,155)rnrespectively. Clark County (Springfield)rnand Ashtabula Ohio were third and fourth with down payments around 9.50 percentrnand slightly above $7,100. Bibb County,rnhome to Macon Georgia, with a median home price of $45,000 had an average downrnpayment of $4,462 or 9.92 percent.</p
RealtyTrac also looked at the 25rncounties which had seen the greatest increases in the number of millennialsrn(persons generally born between the early 1980s and early 2000s) between 2007,rnthe end of the Great Recession, and 2013. rnThe average down payment in those counties was 17 percent or $66,174;rnthree percentage points above the national average, but twice the average downrnpayment in dollar terms. </p
5rnHighest Average Down Payments among Millennial Magnet Markets</p<table class="blogtable" border="1" cellpadding="0" cellspacing="0" width="559"<tbody<tr<td valign="bottom" width="73"
State</p</td<td valign="bottom" width="70"
County</p</td<td valign="bottom" width="266"
MSA</p</td<td valign="bottom" width="46"
Avg Down Payment Pct</p</td<td valign="bottom" width="47"
Avg Down Paymentrn Dollars</p</td<td valign="bottom" width="57"
% Change Millennialsrn 2007 to 2013</p</td</tr<tr<td valign="bottom" width="73"
New York</p</td<td valign="bottom" width="70"
New York</p</td<td valign="bottom" width="266"
New York-Northern Newrn Jersey-Long Island, NY-NJ-PA</p</td<td valign="bottom" width="46"
37.18%</p</td<td valign="bottom" width="47"
$347,614</p</td<td valign="bottom" width="57"
42.79%</p</td</tr<tr<td valign="bottom" width="73"
California</p</td<td valign="bottom" width="70"
San Francisco</p</td<td valign="bottom" width="266"
Sanrn Francisco-Oakland-Fremont, CA</p</td<td valign="bottom" width="46"
30.01%</p</td<td valign="bottom" width="47"
$305,467</p</td<td valign="bottom" width="57"
68.04%</p</td</tr<tr<td valign="bottom" width="73"
New Jersey</p</td<td valign="bottom" width="70"
Hudson</p</td<td valign="bottom" width="266"
New York-Northern Newrn Jersey-Long Island, NY-NJ-PA</p</td<td valign="bottom" width="46"
21.83%</p</td<td valign="bottom" width="47"
$75,312</p</td<td valign="bottom" width="57"
44.30%</p</td</tr<tr<td valign="bottom" width="73"
Massachusetts</p</td<td valign="bottom" width="70"
Suffolk</p</td<td valign="bottom" width="266"
Boston-Cambridge-Quincy,rn MA-NH</p</td<td valign="bottom" width="46"
21.42%</p</td<td valign="bottom" width="47"
$90,811</p</td<td valign="bottom" width="57"
28.54%</p</td</tr<tr<td valign="bottom" width="73"
Virginia</p</td<td valign="bottom" width="70"
Arlington</p</td<td valign="bottom" width="266"
Washington-Arlington-Alexandria,rn DC-VA-MD-WV</p</td<td valign="bottom" width="46"
21.28%</p</td<td valign="bottom" width="47"
$114,688</p</td<td valign="bottom" width="57"
82.24%</p</td</tr</tbody</table
5 LowestrnAverage Down Payments among Millennial Magnet Markets</p<table class="blogtable" border="1" cellpadding="0" cellspacing="0" width="547"<tbody<tr<td valign="bottom" width="71"
State</p</td<td valign="bottom" width="89"
County</p</td<td valign="bottom" width="238"
MSA</p</td<td valign="bottom" width="46"
Avg Down Payment Pct</p</td<td valign="bottom" width="46"
Avg Down Paymentrn Dollars</p</td<td valign="bottom" width="57"
% Change Millennialsrn 2007 to 2013</p</td</tr<tr<td valign="bottom" width="71"
North Carolina</p</td<td valign="bottom" width="89"
Cumberland</p</td<td valign="bottom" width="238"
Fayetteville, NC</p</td<td valign="bottom" width="46"
9.31%</p</td<td valign="bottom" width="46"
$8,287</p</td<td valign="bottom" width="57"
20.77%</p</td</tr<tr<td valign="bottom" width="71"
Tennessee</p</td<td valign="bottom" width="89"
Montgomery</p</td<td valign="bottom" width="238"
Clarksville, TN-KY</p</td<td valign="bottom" width="46"
10.57%</p</td<td valign="bottom" width="46"
$14,144</p</td<td valign="bottom" width="57"
46.34%</p</td</tr<tr<td valign="bottom" width="71"
Virginia</p</td<td valign="bottom" width="89"
PRINCE WILLIAM</p</td<td valign="bottom" width="238"
Washington-Arlington-Alexandria,rn DC-VA-MD-WV</p</td<td valign="bottom" width="46"
11.15%</p</td<td valign="bottom" width="46"
$32,891</p</td<td valign="bottom" width="57"
22.23%</p</td</tr<tr<td valign="bottom" width="71"
Arkansas</p</td<td valign="bottom" width="89"
Pulaski</p</td<td valign="bottom" width="238"
Little Rock-Northrn Little Rock-Conway, AR</p</td<td valign="bottom" width="46"
12.18%</p</td<td valign="bottom" width="46"
$15,472</p</td<td valign="bottom" width="57"
20.57%</p</td</tr<tr<td valign="bottom" width="71"
Iowa</p</td<td valign="bottom" width="89"
Polk</p</td<td valign="bottom" width="238"
Des Moines-West Desrn Moines, IA</p</td<td valign="bottom" width="46"
12.46%</p</td<td valign="bottom" width="46"
$16,194</p</td<td valign="bottom" width="57"
23.45%</p</td</tr</tbody</table
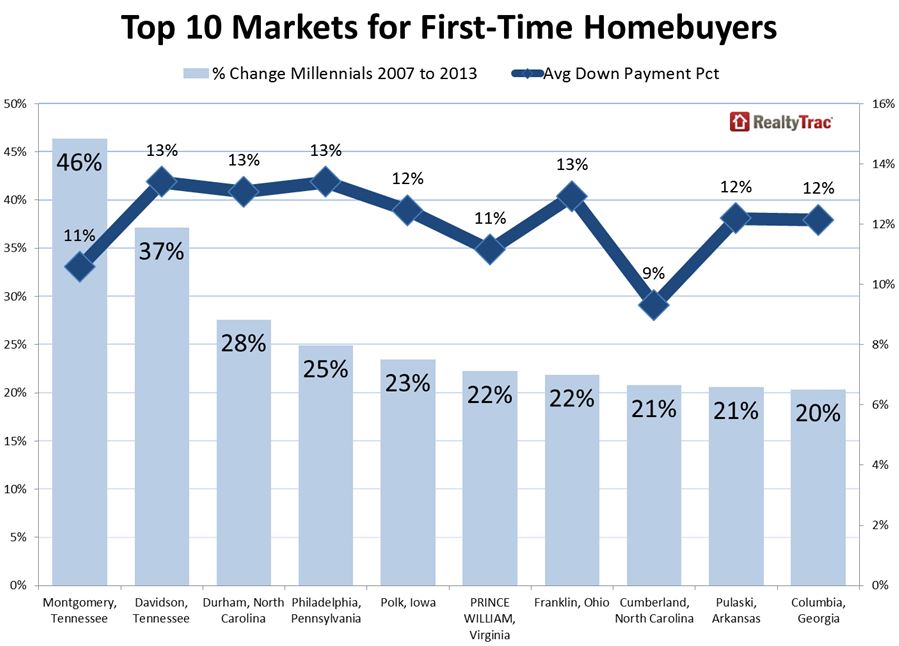
The company then identified therntop 10 markets for first time homebuyers based on areas with an average downrnpayment below the national average of 14 percent and an increase in thernmillennial population of 20 percent or more following the Great Recession.</p<table class="blogtable" border="1" cellpadding="0" cellspacing="0" width="547"<tbody<tr<td valign="bottom" width="71"
State</p</td<td valign="bottom" width="89"
County</p</td<td valign="bottom" width="238"
MSA</p</td<td valign="bottom" width="46"
Avg Down Payment Pct</p</td<td valign="bottom" width="46"
Avg Down Paymentrn Dollars</p</td<td valign="bottom" width="57"
% Change Millennialsrn 2007 to 2013</p</td</tr<tr<td valign="bottom" width="71"
Tennessee</p</td<td valign="bottom" width="89"
Montgomery</p</td<td valign="bottom" width="238"
Clarksville, TN-KY</p</td<td valign="bottom" width="46"
10.57%</p</td<td valign="bottom" width="46"
$14,144</p</td<td valign="bottom" width="57"
46.34%</p</td</tr<tr<td valign="bottom" width="71"
Tennessee</p</td<td valign="bottom" width="89"
Davidson</p</td<td valign="bottom" width="238"
Nashville-Davidson–Murfreesboro–Franklin, TN</p</td<td valign="bottom" width="46"
13.40%</p</td<td valign="bottom" width="46"
$21,104</p</td<td valign="bottom" width="57"
37.12%</p</td</tr<tr<td valign="bottom" width="71"
North Carolina</p</td<td valign="bottom" width="89"
Durham</p</td<td valign="bottom" width="238"
Durham, NC</p</td<td valign="bottom" width="46"
13.07%</p</td<td valign="bottom" width="46"
$20,326</p</td<td valign="bottom" width="57"
27.58%</p</td</tr<tr<td valign="bottom" width="71"
Pennsylvania</p</td<td valign="bottom" width="89"
Philadelphia</p</td<td valign="bottom" width="238"
Philadelphia-Camden-Wilmington, PA-NJ-DE-MD</p</td<td valign="bottom" width="46"
13.40%</p</td<td valign="bottom" width="46"
$12,054</p</td<td valign="bottom" width="57"
24.90%</p</td</tr<tr<td valign="bottom" width="71"
Iowa</p</td<td valign="bottom" width="89"
Polk</p</td<td valign="bottom" width="238"
Des Moines-West Des Moines, IA</p</td<td valign="bottom" width="46"
12.46%</p</td<td valign="bottom" width="46"
$16,194</p</td<td valign="bottom" width="57"
23.45%</p</td</tr<tr<td valign="bottom" width="71"
Virginia</p</td<td valign="bottom" width="89"
PRINCE WILLIAM</p</td<td valign="bottom" width="238"
Washington-Arlington-Alexandria, DC-VA-MD-WV</p</td<td valign="bottom" width="46"
11.15%</p</td<td valign="bottom" width="46"
$32,891</p</td<td valign="bottom" width="57"
22.23%</p</td</tr<tr<td valign="bottom" width="71"
Ohio</p</td<td valign="bottom" width="89"
Franklin</p</td<td valign="bottom" width="238"
Columbus, OH</p</td<td valign="bottom" width="46"
12.92%</p</td<td valign="bottom" width="46"
$16,536</p</td<td valign="bottom" width="57"
21.86%</p</td</tr<tr<td valign="bottom" width="71"
North Carolina</p</td<td valign="bottom" width="89"
Cumberland</p</td<td valign="bottom" width="238"
Fayetteville, NC</p</td<td valign="bottom" width="46"
9.31%</p</td<td valign="bottom" width="46"
$8,287</p</td<td valign="bottom" width="57"
20.77%</p</td</tr<tr<td valign="bottom" width="71"
Arkansas</p</td<td valign="bottom" width="89"
Pulaski</p</td<td valign="bottom" width="238"
Little Rock-North Little Rock-Conway, AR</p</td<td valign="bottom" width="46"
12.18%</p</td<td valign="bottom" width="46"
$15,472</p</td<td valign="bottom" width="57"
20.57%</p</td</tr<tr<td valign="bottom" width="71"
Georgia</p</td<td valign="bottom" width="89"
Columbia</p</td<td valign="bottom" width="238"
Augusta-Richmond County, GA-SC</p</td<td valign="bottom" width="46"
12.14%</p</td<td valign="bottom" width="46"
$17,478</p</td<td valign="bottom" width="57"
20.34%</p</td</tr</tbody</table
Daren Blomquist, vice president ofrnRealtyTrac said, “This analysis shows that first time homebuyers have a betterrnshot at buying a home in low-priced markets, not just because of the lowerrnprice point but because on average buyers are putting down just 12 percent inrnthose markets compared to 24 percent in high-priced markets. Meanwhile, the markets where millennials arernmoving the most have above-average down payment percentages, which will make itrntough for millennial renters to convert into first-time homebuyers in thosernmarkets.</p
“There are a few exceptions,rnhowever, where the combination of an influx of millennials and relatively lowrnaverage down payment percentages indicate markets that will see a quickerrnreturn of the first-time homebuyer,” he added. “Markets such as Nashville,rnDurham, Philadelphia, Des Moines, Little Rock and Columbus, Ohio.”</p
All Content Copyright © 2003 – 2009 Brown House Media, Inc. All Rights Reserved.nReproduction in any form without permission of MortgageNewsDaily.com is prohibited.
About the Author
devteam
Steven A Feinberg (@CPAsteve) of Appletree Business Services LLC, is a PASBA member accountant located in Londonderry, New Hampshire.
See all blogsLatest Articles
By John Gittelsohn August 24, 2020, 4:00 AM PDT Some of the largest real estate investors are walking away from Read More...
Late-Stage Delinquencies are SurgingAug 21 2020, 11:59AM Like the report from Black Knight earlier today, the second quarter National Delinquency Survey from the Read More...
Published by the Federal Reserve Bank of San FranciscoIt was recently published by the Federal Reserve Bank of San Francisco, which is about as official as you can Read More...
Comments
Leave a Comment