
Blog

Reduced Loan Loss Provisions Drive Banker Profitability in Q3
Commercial banks and savingsrninstitutions with FDIC insurance have seen a sizable increase in profitabilityrnover the last year according to the FDIC. </p
The 7,760 banks that reported to the FDICrnstated an aggregate profit of $14.5 billion in the third quarter. This is an increase of $12.5 billion from thernaggregate profit in the third quarter of 2009 and is the fifth consecutivernquarter that earnings have registered a year-over-year increase.</p
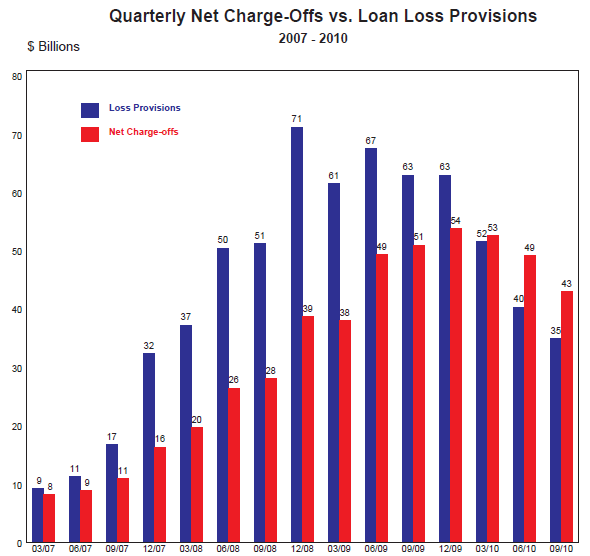
The primary factorrncontributing to the year-over-year improvement in quarterly earnings was arnreduction in provisions for loan losses. While still high, at $34.9 billion, quarterlyrnprovisions were $28 billion (44.5 percent) lower than a year earlier. Netrninterest income was $8.1 billion (8.1 percent) higher than a year ago, andrnrealized gains on securities and other assets improved by $7.3 billion from arnyear ago. </p
The quality of assets inrnthe banks’ portfolios continue to slowly improve although delinquencies remainrnhigh. The amount of loans and leasesrnthat were noncurrent (90 days or more past due or in nonaccrual status) fellrnfor a second consecutive quarter. Insured banks and thrifts charged off $42.9rnbillion in uncollectible loans during the quarter, down $8.1 billion (15.8rnpercent) from a year earlier. This is the second quarter in a row that netrncharge-offs posted a year-over-year decline. </p
“The industryrncontinues making progress in recovering from the financial crisis. Creditrnperformance has been improving, and we remain cautiously optimistic about thernoutlook,” said FDIC Chairman Sheila C. Bair. “Lower provisions forrnloan losses are driving bank earnings by allowing a larger share of revenues tornreach the bottom line.” </p
But Chairman Bair alsornsaid, “At this point in the credit cycle it is too early for institutionsrnto be reducing reserves without strong evidence of sustainable, improving loanrnperformance and reduced loss rates. When it comes to the adequacy of reserves,rninstitutions should always err on the side of caution.”</p
 </p
</p
Total interest income was $133.47rnbillion during the period, down from $134.21 billion in the third quarter ofrn2009, but net interest income increased from $99.4 billion to $107.5 due mainlyrnto a 25% drop in interest expense related to domestic office deposits. Almostrntwo-thirds of all institutions (63.3 percent) reported improvements in theirrnquarterly net income from a year ago, but nearly one in five institutions (18.9rnpercent) had a net loss for the quarter. The average return on assets (ROA), arnbasic yardstick of profitability, rose to 0.44 percent, from 0.06 percent arnyear ago. </p
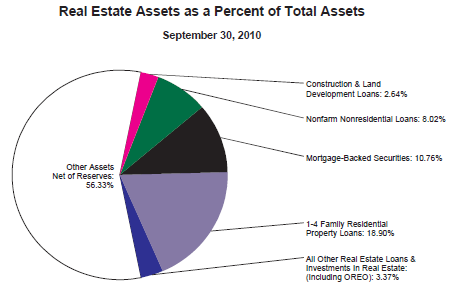
Total assets increased byrn$163 billion (1.2 percent) during the quarter. Investment securities holdingsrnincreased by $113.7 billion (4.5 percent). Assets in trading accounts rose byrn$86.9 billion (12.8 percent). At the end of the third quarter 2010rnparticipating banks owned a total of $1.44 trillion in mortgage backedrnsecurities compared to $1.39 trillion a year earlier. Here is a breakdown of real estate assets owned as a percentage of total assets.</p
 </p
</p
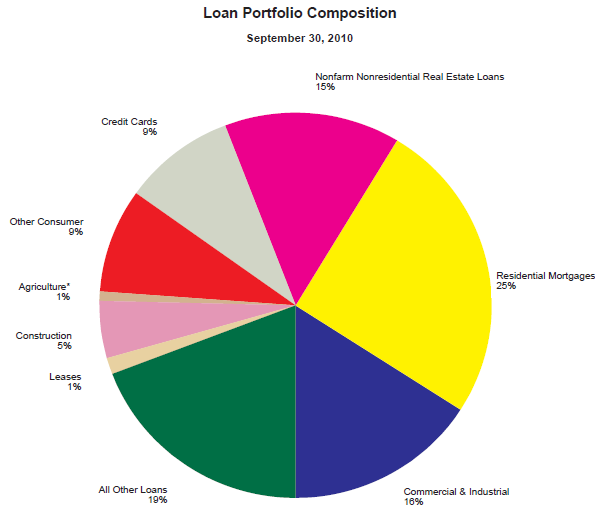
Institutions in thernaggregate held $4.3 trillion in real estate loans of which $1.88 trillion werernsecured by 1-4 unit family homes, down from $1.92 trillion year-over-year. Commercial loans increased from 1.27 trillionrnin 2009Q3 to $1.17 trillion in the most recent period.</p
 </p
</p
Loans Secured by Real Estate ($ millions)</p<table border="0" cellpadding="0" cellspacing="0" width="453"<tbody<tr
</td
</td
</td
</td</tr<tr
</td<td valign="bottom" width="75" nowrap="nowrap"
Q3 2010</p</td<td valign="bottom" width="75" nowrap="nowrap"
Q2 2010</p</td<td valign="bottom" width="75" nowrap="nowrap"
Q3 2009</p</td</tr<tr<td valign="bottom" width="229" nowrap="nowrap"
rn 30-89 days past due</p</td<td valign="bottom" width="75" nowrap="nowrap"
84,821</p</td<td valign="bottom" width="75" nowrap="nowrap"
84,751</p</td<td valign="bottom" width="75" nowrap="nowrap"
100,987</p</td</tr<tr<td valign="bottom" width="229" nowrap="nowrap"
90rn days or more past due</p</td<td valign="bottom" width="75" nowrap="nowrap"
107,420</p</td<td valign="bottom" width="75" nowrap="nowrap"
106,623</p</td<td valign="bottom" width="75" nowrap="nowrap"
87,707</p</td</tr<tr<td valign="bottom" width="229" nowrap="nowrap"
Inrn nonaccrual status</p</td<td valign="bottom" width="75" nowrap="nowrap"
205,718</p</td<td valign="bottom" width="75" nowrap="nowrap"
211,472</p</td<td valign="bottom" width="75" nowrap="nowrap"
203,369</p</td</tr<tr<td valign="bottom" width="229" nowrap="nowrap"
rn Total outstanding</p</td<td valign="bottom" width="75" nowrap="nowrap"
4,302,273</p</td<td valign="bottom" width="75" nowrap="nowrap"
4,337,167</p</td<td valign="bottom" width="75" nowrap="nowrap"
4,527,197</p</td</tr<tr<td valign="bottom" width="229" nowrap="nowrap"
rn 30-89 day past due rate</p</td<td valign="bottom" width="75" nowrap="nowrap"
1.97%</p</td<td valign="bottom" width="75" nowrap="nowrap"
1.95%</p</td<td valign="bottom" width="75" nowrap="nowrap"
2.23%</p</td</tr<tr<td valign="bottom" width="229" nowrap="nowrap"
Noncurrentrn rate</p</td<td valign="bottom" width="75" nowrap="nowrap"
7.28%</p</td<td valign="bottom" width="75" nowrap="nowrap"
7.33%</p</td<td valign="bottom" width="75" nowrap="nowrap"
6.43%</p</td</tr</tbody</table
</p
Charge Offs- All Real Estate Loans ($ millions)</p<table border="0" cellpadding="0" cellspacing="0" width="453"<tbody<tr
Q3 2010</p</td<td valign="bottom" width="75" nowrap="nowrap"
Q2 2010</p</td<td valign="bottom" width="75" nowrap="nowrap"
Q3 2009</p</td</tr<tr<td valign="bottom" width="229" nowrap="nowrap"
rn Total charge-offs</p</td<td valign="bottom" width="75" nowrap="nowrap"
20,836</p</td<td valign="bottom" width="75" nowrap="nowrap"
22,305</p</td<td valign="bottom" width="75" nowrap="nowrap"
26,011</p</td</tr<tr<td valign="bottom" width="229" nowrap="nowrap"
rn Total recoveries</p</td<td valign="bottom" width="75" nowrap="nowrap"
1,041</p</td<td valign="bottom" width="75" nowrap="nowrap"
1,095</p</td<td valign="bottom" width="75" nowrap="nowrap"
582</p</td</tr<tr<td valign="bottom" width="229" nowrap="nowrap"
Netrn charge-offs</p</td<td valign="bottom" width="75" nowrap="nowrap"
19,795</p</td<td valign="bottom" width="75" nowrap="nowrap"
21,210</p</td<td valign="bottom" width="75" nowrap="nowrap"
25,428</p</td</tr<tr<td valign="bottom" width="229" nowrap="nowrap"
rn Average outstanding</p</td<td valign="bottom" width="75" nowrap="nowrap"
4,321,049</p</td<td valign="bottom" width="75" nowrap="nowrap"
4,352,310</p</td<td valign="bottom" width="75" nowrap="nowrap"
4,569,119</p</td</tr<tr<td valign="bottom" width="229" nowrap="nowrap"
Netrn charge-off rate</p</td<td valign="bottom" width="75" nowrap="nowrap"
1.83%</p</td<td valign="bottom" width="75" nowrap="nowrap"
1.95%</p</td<td valign="bottom" width="75" nowrap="nowrap"
2.23</p</td</tr</tbody</table
Loans Secured by 1-4 Family Homes ($ millions)</p<table border="0" cellpadding="0" cellspacing="0" width="453"<tbody<tr
Q3 2010</p</td<td valign="bottom" width="70" nowrap="nowrap"
Q2 2010</p</td<td valign="bottom" width="80" nowrap="nowrap"
Q3 2009</p</td</tr<tr
rn 30-89 days past due</p</td<td valign="bottom" width="78" nowrap="nowrap"
61,604</p</td<td valign="bottom" width="70" nowrap="nowrap"
59,959</p</td<td valign="bottom" width="80" nowrap="nowrap"
63,324</p</td</tr<tr<td valign="bottom" width="225" nowrap="nowrap"
90rn days or more past due</p</td<td valign="bottom" width="78" nowrap="nowrap"
93,845</p</td<td valign="bottom" width="70" nowrap="nowrap"
92,451</p</td<td valign="bottom" width="80" nowrap="nowrap"
94,211</p</td</tr<tr<td valign="bottom" width="225" nowrap="nowrap"
Inrn nonaccrual status</p</td<td valign="bottom" width="78" nowrap="nowrap"
100,022</p</td<td valign="bottom" width="70" nowrap="nowrap"
102,475</p</td<td valign="bottom" width="80" nowrap="nowrap"
104,557</p</td</tr<tr<td valign="bottom" width="225" nowrap="nowrap"
rn Total outstanding</p</td<td valign="bottom" width="78" nowrap="nowrap"
2,528,387</p</td<td valign="bottom" width="70" nowrap="nowrap"
2,529,195</p</td<td valign="bottom" width="80" nowrap="nowrap"
2,546,785</p</td</tr<tr<td valign="bottom" width="225" nowrap="nowrap"
rn 30-89 day past due rate</p</td<td valign="bottom" width="78" nowrap="nowrap"
2.44%</p</td<td valign="bottom" width="70" nowrap="nowrap"
2.37%</p</td<td valign="bottom" width="80" nowrap="nowrap"
2.49%</p</td</tr<tr<td valign="bottom" width="225" nowrap="nowrap"
rn Noncurrent rate</p</td<td valign="bottom" width="78" nowrap="nowrap"
7.67%</p</td<td valign="bottom" width="70" nowrap="nowrap"
7.71%</p</td<td valign="bottom" width="80" nowrap="nowrap"
7.80%</p</td</tr</tbody</table
Bair noted that the end ofrna two-year period of contraction in loan portfolios may be over. “Totalrnloans and leases held by FDIC-insured institutions declined by just $6.8rnbillion, or 0.1 percent, in the third quarter,” she said. “Many largernbanks have had sizable reductions in their loan portfolios over the past couplernof years, but in the third quarter, such reductions were notably absent. I hopernwe are close to seeing genuine increases in loan balances again.” </p
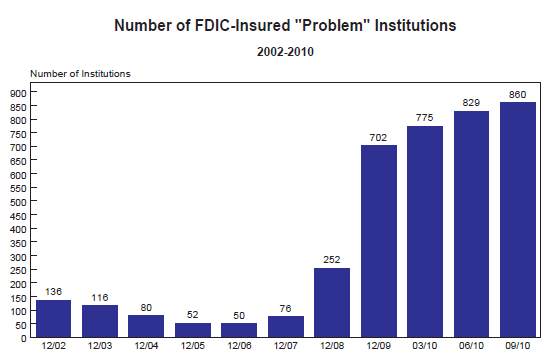
Thernnumber of troubled institutions on the FDIC’s watch list increased from 829 torn860, the highest number on the list since 1993. rnThe total assets of those banks however declined from $403 billion to $379rnbillion. Forty-one insured institutions failed during the third quarter, for arntotal thus far in 2010 of 127. </p
 </p
</p
Despite the continuing bank failures, the balance improved from negative $15.2 billion to negative $8rnbillion during the third quarter. The improvement stemmed primarily fromrnassessment revenues and from a reduction in the contingent loss reserve. Thisrnreserve, which covers the costs of expected failures, declined from $27.5rnbillion to $21.3 billion during the quarter. While part of the decline reflectsrnthe removal of amounts reserved for banks that failed, part also reflects lowerrncosts for future failures. </p
Chart Source: http://www2.fdic.gov/qbp/2010sep/grbook/QBPGR.pdf
All Content Copyright © 2003 – 2009 Brown House Media, Inc. All Rights Reserved.nReproduction in any form without permission of MortgageNewsDaily.com is prohibited.
About the Author
devteam
Steven A Feinberg (@CPAsteve) of Appletree Business Services LLC, is a PASBA member accountant located in Londonderry, New Hampshire.
See all blogsLatest Articles
By John Gittelsohn August 24, 2020, 4:00 AM PDT Some of the largest real estate investors are walking away from Read More...
Late-Stage Delinquencies are SurgingAug 21 2020, 11:59AM Like the report from Black Knight earlier today, the second quarter National Delinquency Survey from the Read More...
Published by the Federal Reserve Bank of San FranciscoIt was recently published by the Federal Reserve Bank of San Francisco, which is about as official as you can Read More...
Comments
Leave a Comment