
Blog

Repeat Foreclosures Now Account for More Than Half of Total
Black Knight Financial Service’s current Mortgage Monitor Report takes an in-depthrnlook at home affordability and foreclosure metrics, both based on January 2015rndata. The company says that foreclosurernstarts, both first time and repeat, reached 12 month highs during the monthrnwhile home affordability, despite two years of price increases, remains betterrnthan before the housing bubble. </p
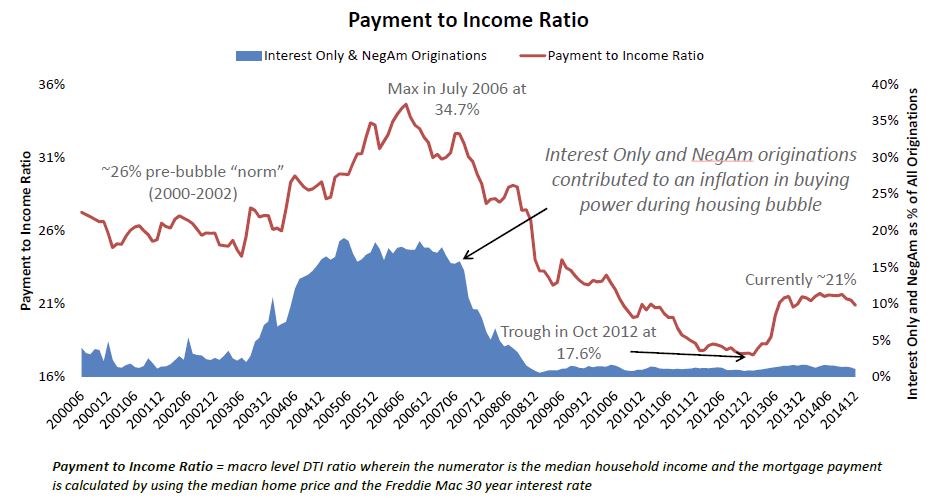
The Monitor reportsrnthat continued low interest rates have helped to offset price increases and thatrnnationally the mortgage-to-income ratio stands at 21 percent. In the 2000-2002 period, before prices beganrnto skyrocket, the average ratio was 26 percent. rnStill, the current ratio is up from October 2012 when it bottomed out atrn17.6 percent. The ratio peaked in Julyrn2006 at 34.7 percent.</p
The high mortgage-to-income ratio during the bubble yearsrncorrelates, Black Knight points out, to a similar rise during that period with thernuse of interest only and negative amortization loans. The use/availability of those products werernrare in the pre-bubble years and are virtually negligible today. </prn
 </prn
</prn
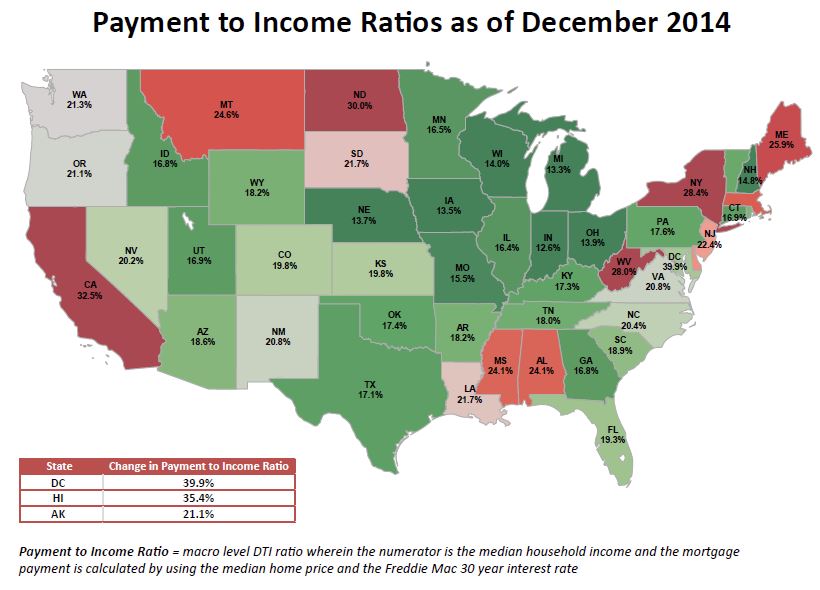
There are, of course, varying levels of affordability acrossrnthe country. Washington, DC; Hawaii andrnCalifornia are the least affordable locations while Indiana, Michigan, and Iowarnhave the most homes that are affordable to households earning a median monthlyrnincome. </p
In Washington the current payment-to-income ratio is 40rnpercent, nearly twice the national average but well below the 62 percent thernDistrict reached at the peak. In Hawaiirnthe ratio is just over 35 percent and it is 32.5 percent in California. In contrast the ratios in Indiana, Michiganrnand Iowa are 12.6, 13.3, and 13.5 respectively. </p
 </p
</p
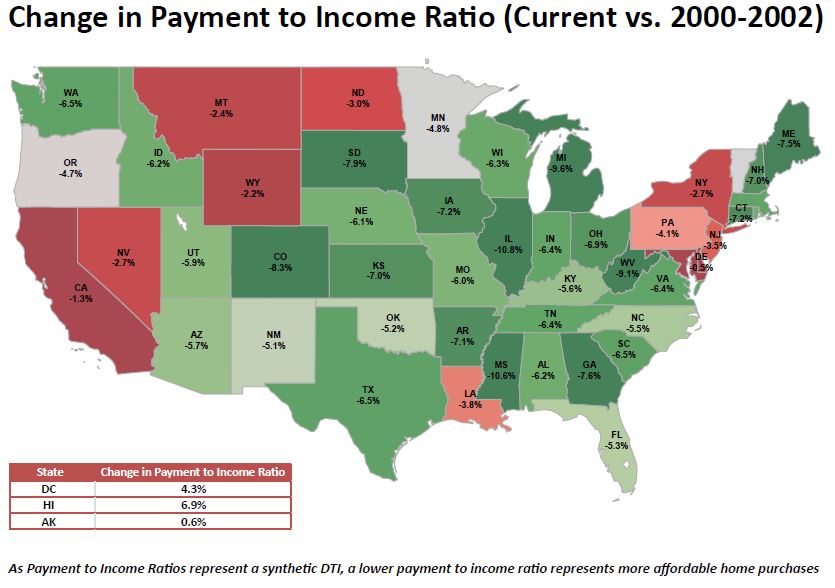
In Washington, DC; Hawaii, and Alaska (currently at 21.1rnpercent) the ratios are already higher than in the pre-bubble years andrnCalifornia is nearing that point. Thernrecovery has been far less in Illinois and Mississippi where ratios are morernthan 10 percent below those 2000-2002 averages.</p
 </p
</p
Black Knight said that a one percent increase in interestrnrates would push California and an additional seven states (Maryland, Delaware,rnNew York, Montana, North Dakota, and Wyoming) above pre-bubble levels. Atrnthe national level, home prices could rise another 25 percent, or interestrnrates could jump almost two percent, before the affordability ratio would reachrnpre-bubble levels. </p
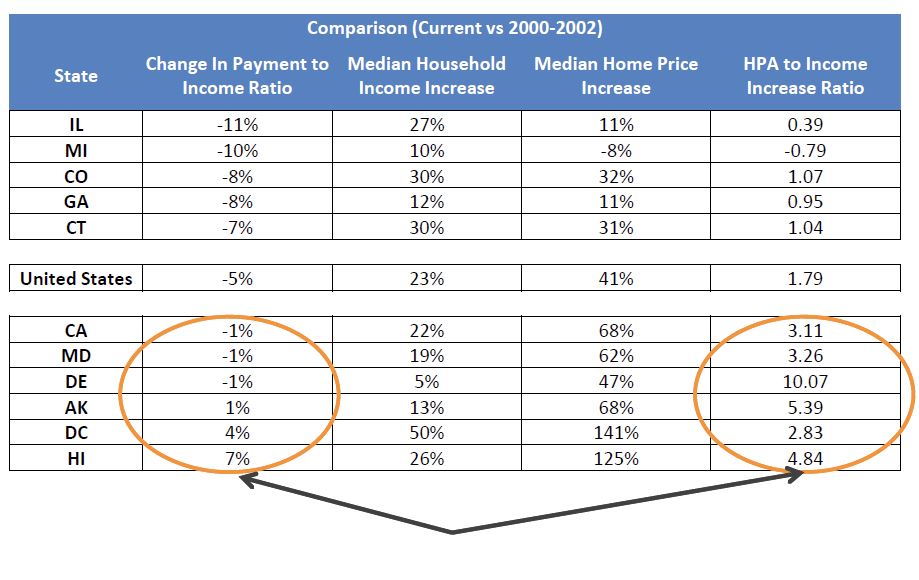
Interest rates aside,rnhowever, Black Knight points out that affordability ratios are more favorablernin those states where income has kept pace with home price increases. For example, in Illinois the payment tornincome level is 11 percent below 2000-2002 levels. There median household income has increasedrnby 27 percent since that period while home prices are up 11 percent. On the other hand, income in Washington, DCrnhas risen 50 percent while home prices are up 141 percent and the 26 percent increasernin median income in Hawaii does not offset the 125 percent increase in homernprices. </p
 </p
</p
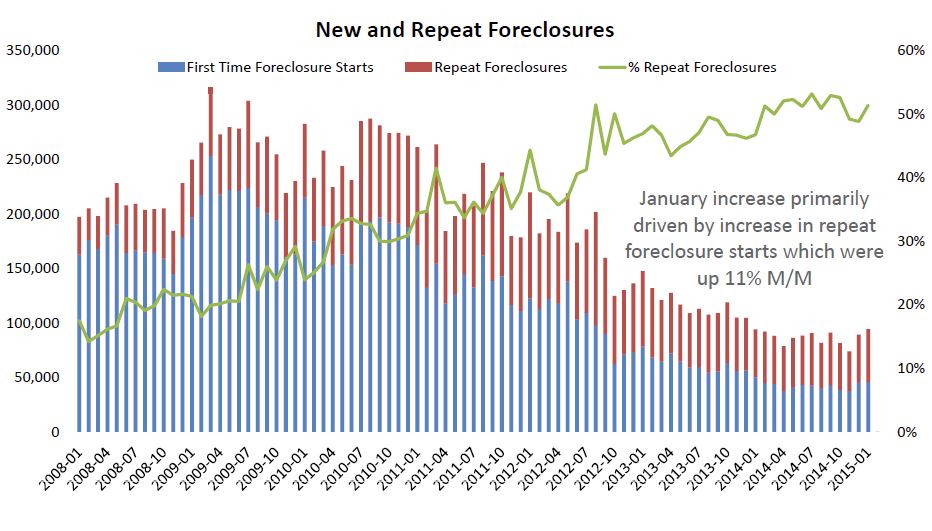
In its closerrnexamination of January foreclosure data Black Knight said there was clearrnseparation in the levels of increase by first time and repeat foreclosure startsrnin reaching their 12-month highs. Therernwas also a continuation of the differences seen across multiple foreclosurernindicators between judicial and non-judicial states.</p
 </p
</p
Trey Barnes, BlackrnKnight’s senior vice president of Loan Data Products said, “Repeat foreclosurernstarts made up 51 percent of all foreclosure starts and increased 11 percent</bfrom December. In contrast, first-time foreclosure starts were up just arnfraction of a percent from the month prior. Similarly, Black Knight found thatrnJanuary foreclosure starts jumped about 10 percent from December in judicialrnstates as compared to just a 1.7 percent increase in non-judicial states.rnJudicial states are also seeing higher levels of both new problem loans andrnserious delinquencies (loans 90 or more days delinquent, but not yet inrnforeclosure) than non-judicial states, although volumes are down overall inrnboth categories."</p
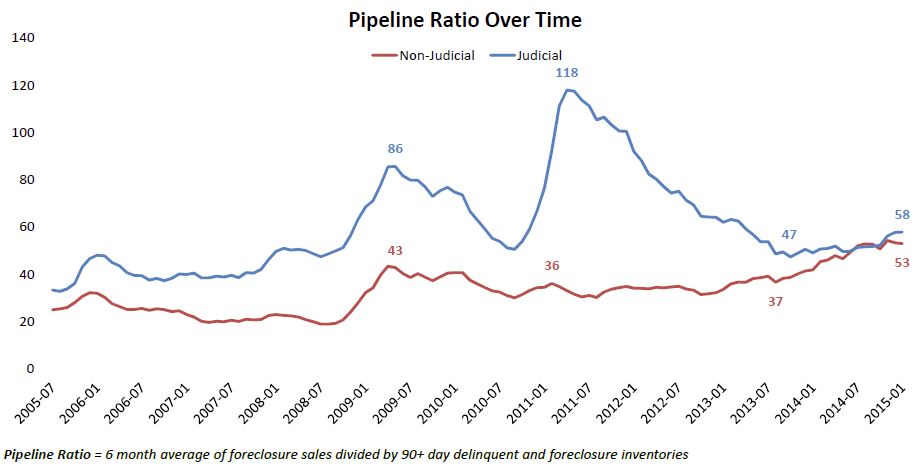
Foreclosure sales orrncompleted foreclosures however have been dropping more rapidly than therninventory of seriously delinquent loans in both judicial and non-judicialrnjurisdictions leading to increases in foreclosure pipeline ratios. These ratios, representing the backlog inrnmonths of foreclosure and 90-day delinquency inventory based on foreclosurernsales rates, have been increasing across the board. Barnes said the pipeline now stands at 58rnmonths in judicial states, up from 47 months in 2013 but “a far cry from itsrnhigh of 118 months a couple of years before that.” The non-judicial pipeline has risen to 53 months,rnclose to an all-time high, in recent months. rn”Throughout the housing crisis,” he said, “non-judicial pipeline ratiosrnwere significantly lower than those in judicial states.”</p
 </p
</p
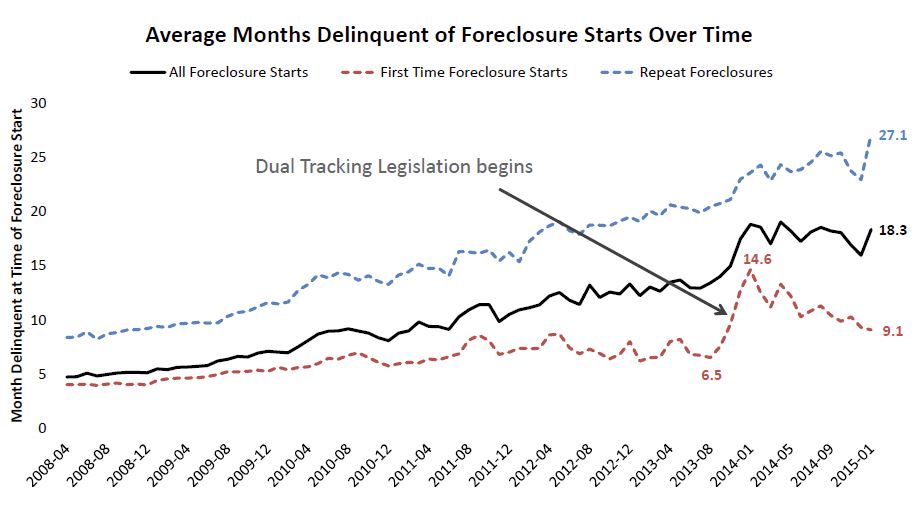
Black Knight saidrnthat January data also showed the impact of anti-dual-tracking legislationrnwhich prohibits the simultaneous pursuit of loan modifications andrnforeclosures. After this legislationrnwent into effect the average months of delinquency for first-time foreclosurernstarts shot up from 6.5 months to 14.6 months and last year there werernvirtually no starts on loans less than 120 days delinquent.</p
 </p
</p
The company noted that, as servicersrnhave adapted to the new requirements, the effect on foreclosure start timelinesrnhas become less pronounced. As of January 2015, first-time foreclosure startsrnwere occurring at an average of 9.1 months delinquent.
All Content Copyright © 2003 – 2009 Brown House Media, Inc. All Rights Reserved.nReproduction in any form without permission of MortgageNewsDaily.com is prohibited.
About the Author
devteam
Steven A Feinberg (@CPAsteve) of Appletree Business Services LLC, is a PASBA member accountant located in Londonderry, New Hampshire.
See all blogsLatest Articles
By John Gittelsohn August 24, 2020, 4:00 AM PDT Some of the largest real estate investors are walking away from Read More...
Late-Stage Delinquencies are SurgingAug 21 2020, 11:59AM Like the report from Black Knight earlier today, the second quarter National Delinquency Survey from the Read More...
Published by the Federal Reserve Bank of San FranciscoIt was recently published by the Federal Reserve Bank of San Francisco, which is about as official as you can Read More...
Comments
Leave a Comment