
Blog

Servicer Complaints Ebbing with Delinquencies
Black Knight’srnMortgage Monitor report for May tookrna close look at complaint trends lodged with the Consumer Financial ProtectionrnAgency (CFPB). Along with the Five StarrnInstitute, Black Knight compared complaints with corresponding mortgage servicingrnvolume from the first quarter of 2013 to the fourth quarter of 2014. </p
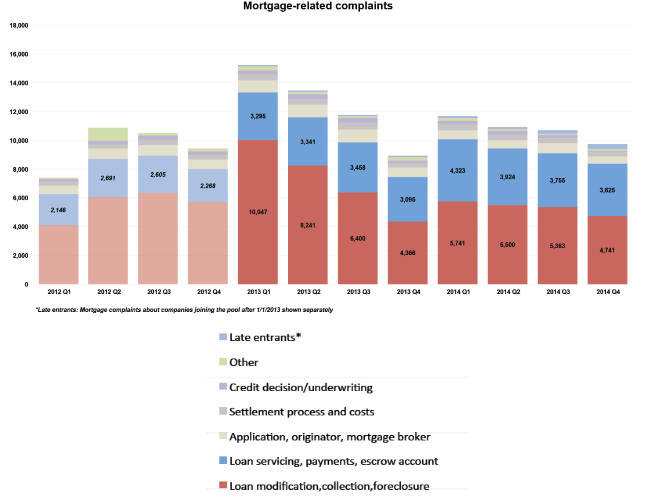
The analysisrnfound that mortgage-related complaints to CFPB peaked in the first quarter of 2013rnat a little under 16,000 and have been trending downward over the past 48rnmonths. They have generally observed arnseasonal pattern, increasing in the first quarter of each year and thenrndeclining through the next three.</p
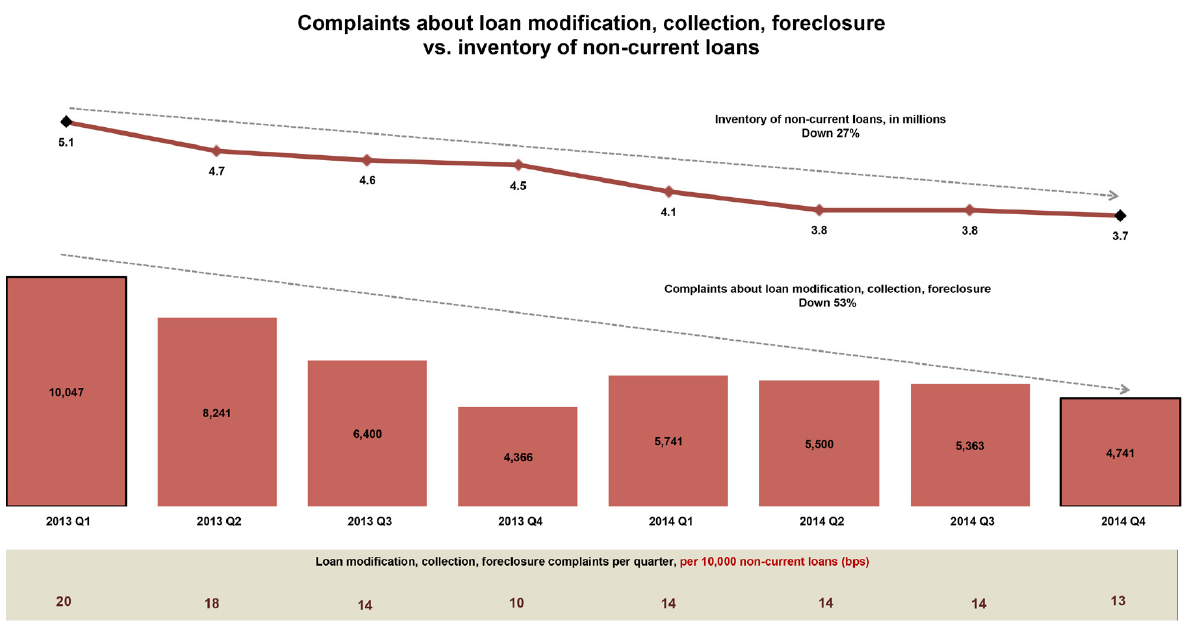
The analysisrnfocused on two servicing categories; loan servicing which includes payments andrnescrow account complaints and loan modification, collection and foreclosurerncomplaints. The first set were comparedrnto the inventory of current loans over time and the second set were comparedrnagainst the inventory of non-current loans. rnThat latter group make up the bulk of all complaints.</p
 </p
</p
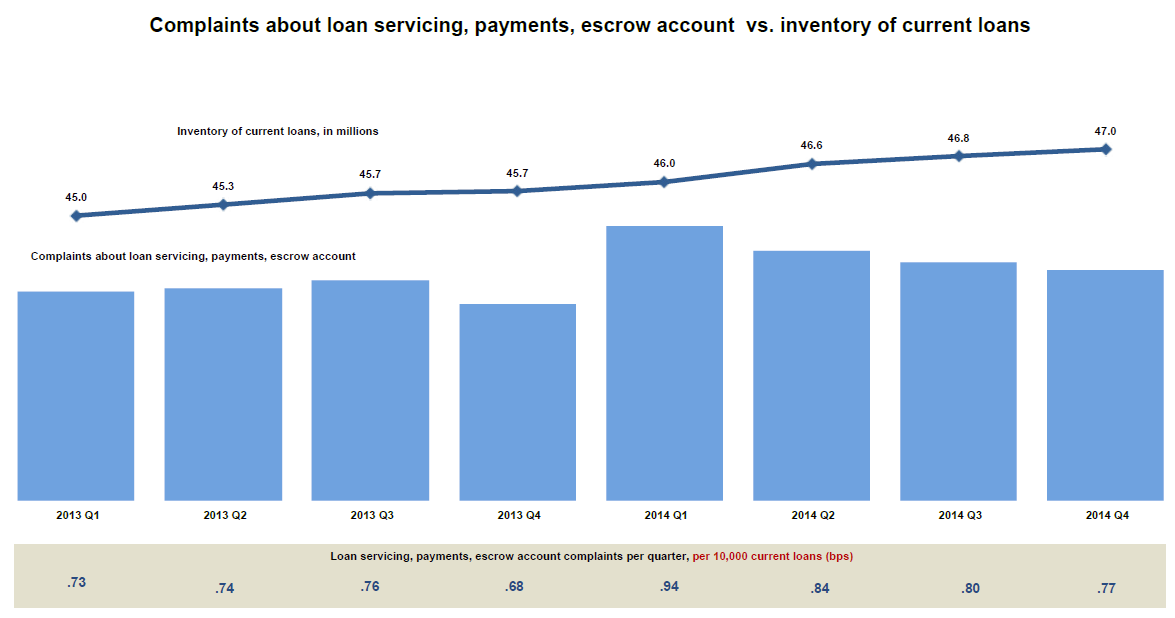
Since the firstrnquarter of 2013 the inventory of current loans has increased from 45 millionrnborrowers to 47 million in the Q4 of 2014. rnAt the same time loans 30 or more days past due has dropped from 5.1rnmillion to 3.7 million. While that is arn27 percent decrease, the number of modification, collection, and foreclosurernrelated complains has dropped by 53 percent over the same period. In the last quarter analyzed there werernapproimately13 delinquency related complains per 10,000 loans.</p
 </p
</p
Loanrnservicing, escrow, and payment related complaints have held relatively stable</bas compared to the inventory of current loans since the first quarter of 2013 -rnless than one complaint per 10,000 loans.</p
 </p
</p
Black Knightrnsaid the spike in complaints seen in Q1 2014 (which, from the chart regardingrnmortgage related complaints above could as easily be viewed as an atypicalrndecline in the four quarter of 2013) was broad-based and spread across allrnsizes of servicers. It could potentiallyrnindicate more of a result of CFPB’s media efforts than discrete servicer action.</p
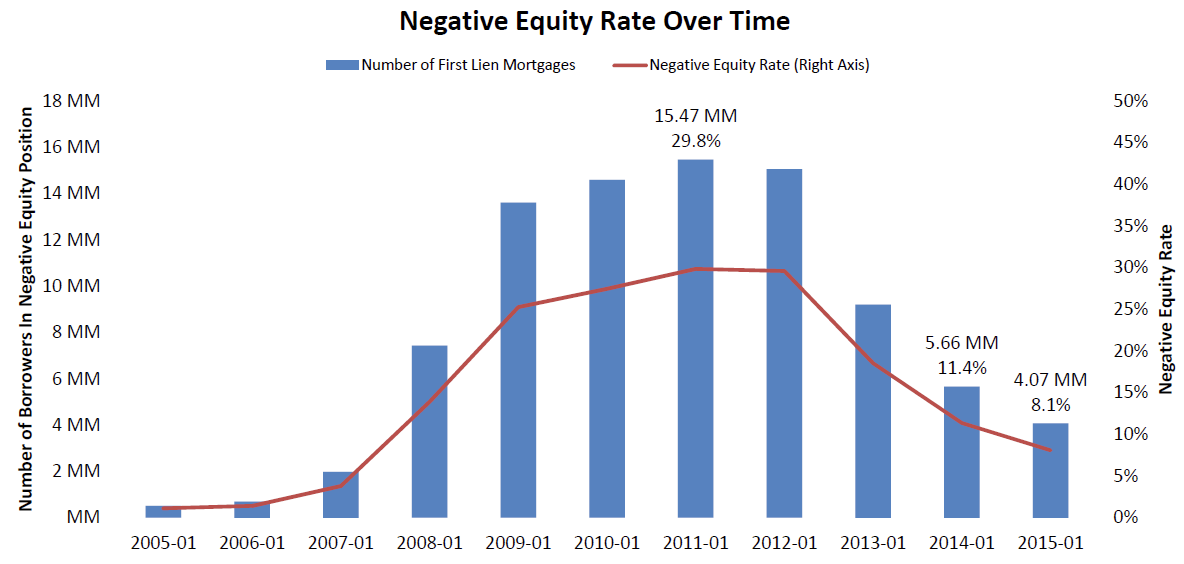
The Monitor also looked at negative equity, finding that over the last year the number of underwater borrower has decreased by 1.6 million. Twenty-nine percent of underwater borrowers are seriously delinquent on their mortgages and borrowers in negative equity positions make up 77 percent of all active foreclosures. In fact, the company said, one of every three borrowers in active foreclosure has a current loan-to-value ratio of 150 or more, meaning they owe 50 percent more than their homes are worth. 72 percent of those 90 or more days past due are also underwater</p
 </p
</p
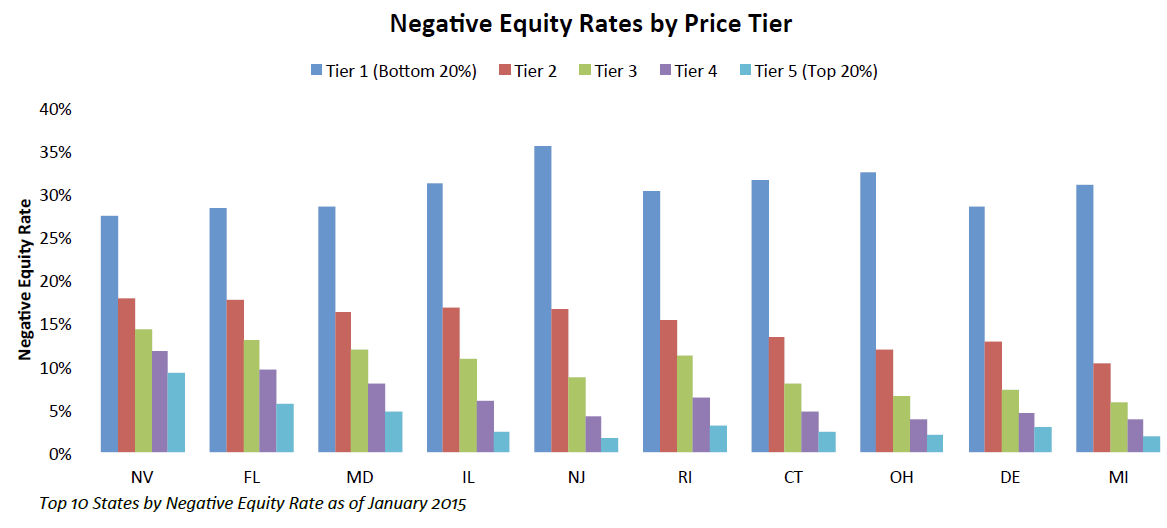
Black Knight tracks its home valuernestimates separately, using one home price estimate for all mortgages andrnanother which excludes distressed properties. rnIts senior vice president of Data and Analytics, Ben Graboske said therncompany has the benefit of knowing current unpaid balances on millions of firstrnlien mortgages every month and is also able to separately and distinctly valuerndistressed and non-distressed properties down to the ZIP code level. This allows them to determine equityrnpositions, especially in heavily distressed communities. The trend, Graboske said, is one of overall improvementrnthough negative equity distribution varies considerably depending upon geographicalrnlocation and home values within a given market. </p
“We drilled down to take a closer lookrnat how this was playing out geographically and among different property pricerntiers. Nevada and Florida continue to see the nation’s highest negative equityrnrates, with 16.4 and 15.1 percent of borrowers being underwater in thosernstates, respectively.” He continued, “In terms of price tiers, we found that thernbottom 20 percent of homes by price continue to struggle with negative equity,rnwhile negative equity rates on high-end homes – the top 20 percent by price -rnare limited, even in the hardest hit states. In fact, when reviewing at thernstate level, borrowers in the bottom 20 percent of homes by price are ninerntimes more likely to be underwater on their mortgages than those in the top 20rnpercent.”</p
 </p
</p
The Monitor also said that the drop in thernmortgage delinquency rate in March was the largest monthly decline in nine years</b- 12.2 percent – and declines were seen across all stages of delinquencies withrnthe 30-day bucket hitting the lowest level in over 10 years. For every 10,000 loans that were current atrnthe end of February, only 73 borrowers missed a payment in March, marking thernlowest current-to-30 roll rate in over 15 years. Roll rates from 30-to-60 andrn60-to-90 days delinquent hit their lowest levels since March 2006. Finally, thernrate of loans curing from 30-days delinquent to current status was 40.7rnpercent, the highest level since March 2005 and slightly above the 2000-2005rnaverage of 40.4 percent.
All Content Copyright © 2003 – 2009 Brown House Media, Inc. All Rights Reserved.nReproduction in any form without permission of MortgageNewsDaily.com is prohibited.
About the Author
devteam
Steven A Feinberg (@CPAsteve) of Appletree Business Services LLC, is a PASBA member accountant located in Londonderry, New Hampshire.
See all blogsLatest Articles
By John Gittelsohn August 24, 2020, 4:00 AM PDT Some of the largest real estate investors are walking away from Read More...
Late-Stage Delinquencies are SurgingAug 21 2020, 11:59AM Like the report from Black Knight earlier today, the second quarter National Delinquency Survey from the Read More...
Published by the Federal Reserve Bank of San FranciscoIt was recently published by the Federal Reserve Bank of San Francisco, which is about as official as you can Read More...
Comments
Leave a Comment