
Blog

Shadow Inventory Back to 2009 Levels: CoreLogic
The nation’srnshadow inventory dropped to 2.3 million housing units in July, down 10.2rnpercent from where it stood one year earlier. According to CoreLogic’s reportrnon the subject, released this morning, in the same month in 2011 the inventoryrnwas 2.6 million units. The dollar volumernof the inventory in the most recent month was $382 billion compared to $397rnbillion the year before. The shadowrninventory has now returned to the approximate level of March 2009. The current inventory represents a 6.3 monthrnsupply.</p
CoreLogic estimatesrnthe current stock of properties in the shadow inventory or pending supply byrncalculating the number of properties that are seriously delinquent, inrnforeclosure, or held as real estate owned (REO) by banks by not currentlyrnlisted by multiple listing services.</p
The Julyrninventory represented just over three-fourths of the 2.7 million propertiesrnthat were seriously delinquent, in foreclosure or in bank-owned inventoriesrn(REO) at the time the data was compiled. rnCurrently the flow of new seriously delinquent (90+ days) into thernshadow inventory has been roughly offset by sales of REO and short sales.</p
Propertiesrnthat are already in REO in July totaled 345,000 or 15 percent of the inventoryrnand represent a 1.0 month supply at the current rate of absorption. There were 1 million seriously delinquentrnloans, a 2.9 month supply. Properties inrnsome state of foreclosure numbered 900,000, a 2.5 month supply.</p
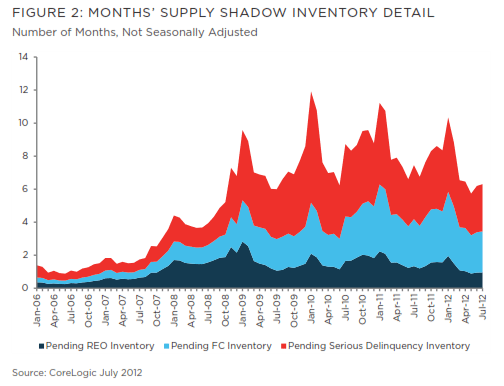
Seriouslyrndelinquent loans are the main driver of the shadow inventory and between Aprilrnand July this number declined substantially in a number of states. These delinquencies were down 3.2 percent inrnArizona, 2.8 percent in Pennsylvania, 2.3 percent in New Jersey and 2.2 percentrnin both Delaware and Maine. </p
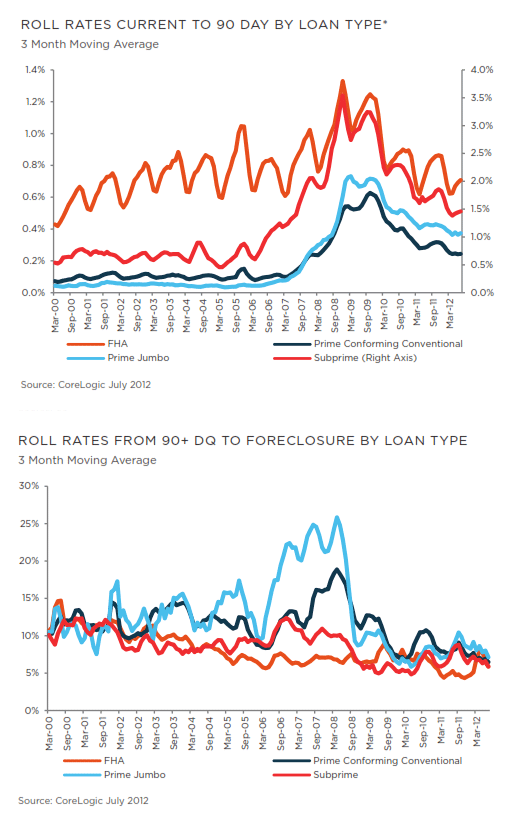
Roll rates are therntransition rates of loans from one state ofrnperformance to thernnext. rnCoreLogic said that, beginning withrnthis report, curernrates are factored in as wellrntorncapture the rise in foreclosure timelines andrnfurtherrnenhancernthernaccuracy of the shadow inventoryrnanalysis. </p
Transition rates of “delinquency to foreclosure” and “foreclosure to REO” are used to identify therncurrently distressedrnnon-listed properties most likely tornbecome REO properties.</p
 </p
</p
AnandrnNallathambi, president and CEO of CoreLogic commented, “Broadly speaking, thernshadow inventory continued to shrink in July. rnThe reduction is being driven by a variety of resolution approaches. This is yet another hopeful sign that thernhousing market is slowly healing.”</p
“The declinernin shadow inventory has recently moderated reflecting the lower outflow ofrndistressed sales over the past year,” Mark Fleming, CoreLogic’s chief economistrnsaid. “While a lower outflow of distressedrnsales helps alleviate downward home price pressure, long foreclosure timelinesrnin some parts of the country causes these pools of shadow inventory to remainrnin limbo for an extended period of time.” rn</p
As of July 2012, Florida, California, Illinois, New York and New Jerseyrnmake up 45 percentrnofrnall distressed properties in the country.</p
All Content Copyright © 2003 – 2009 Brown House Media, Inc. All Rights Reserved.nReproduction in any form without permission of MortgageNewsDaily.com is prohibited.
About the Author
devteam
Steven A Feinberg (@CPAsteve) of Appletree Business Services LLC, is a PASBA member accountant located in Londonderry, New Hampshire.
See all blogsLatest Articles
By John Gittelsohn August 24, 2020, 4:00 AM PDT Some of the largest real estate investors are walking away from Read More...
Late-Stage Delinquencies are SurgingAug 21 2020, 11:59AM Like the report from Black Knight earlier today, the second quarter National Delinquency Survey from the Read More...
Published by the Federal Reserve Bank of San FranciscoIt was recently published by the Federal Reserve Bank of San Francisco, which is about as official as you can Read More...
Comments
Leave a Comment