Blog

Shadow Inventory On The Rise After 2012 Foreclosure Legislation
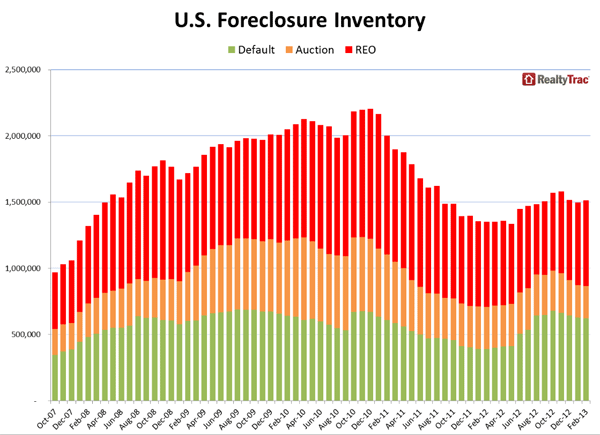
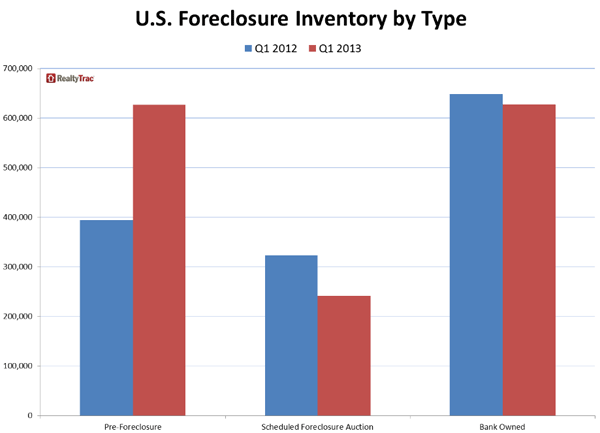
A newrnreport issued today by RealtyTrac says that the U.S. foreclosure inventory hasrnincreased by about 12 percent since May 2012 when it hit a five-year low of 1.3rnmillion properties. Today that inventoryrnstands at about 1.5 million and is up 9 percent form the first quarter ofrn2012. The foreclosure inventory consistsrnof homes actively in the foreclosure process and bank-owned homes or REO. </p
RealtyTracrnsays it was the finalization of the National Mortgage Settlement in April 2012rnthat triggered the growth of the inventory which is driven by a 59 percent jumprnin properties in some stage of foreclosure. rnThe inventory is down from a peak of 2.2 million properties in Decemberrn2010. </p
“Delinquentrnloans that fell into a deep sleep after the robo-signing controversy in latern2010 are gradually coming out of hibernation following the finalization of thernnational mortgage settlement in April 2012,” said Daren Blomquist, vicernpresident at RealtyTrac. “The settlement provided some closure regardingrnaccepted foreclosure processing practices, and as a result lenders have beenrnreviving more of these delinquent loans and pushing them into foreclosure overrnthe past 12 months, particularly in states where a lengthy court process hasrnresulted in a bigger backlog of non-performing loans still in snooze mode.”</p
 </p
</p
The cumulative estimated marketrnvalue of homes in foreclosure or bank owned was $200 billion as of the firstrnquarter of 2013, up 14 percent from the $175 billion cumulative estimated valuernin the first quarter of 2012.</p
Increases in inventory were by nornmeans uniform. Twenty-six states postedrnannual increases in the foreclosure inventory while those in 24 states and thernDistrict of Colombia fell in the first quarter on an annual basis in the firstrnquarter. As RealtyTrac points out, notrnsurprisingly the different behavior was highly correlated to the type ofrnforeclosure process used in the state. rnNineteen of the 26 states in which the inventory grew are judicial processrnstates which have been more susceptible to backlogs of “shadow” foreclosurerninventory being built up over the past few years due to more lengthy foreclosure timelines.</p
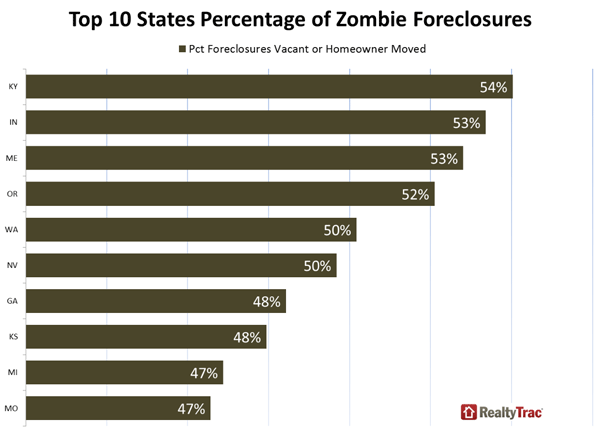
RealtyTrac cross-referencedrnforeclosure data with post office data and found that 35 percent of thernproperties in the process of foreclosure nationally were vacant. Florida had by far the largest number withrn90,000 properties flagged as vacant followed by Illinois with 28,821 and Ohiornwith 17,367. By percentage, in sixrnstates these so called “zombie foreclosures” constituted half or more of thernshadow inventory.</p
 </p
</p
RealtyTrac said many of these arernproperties where owners have moved in anticipation of a foreclosure that hasrnnot occurred and may not realize they remain responsible for maintenance andrnproperty taxes. </p
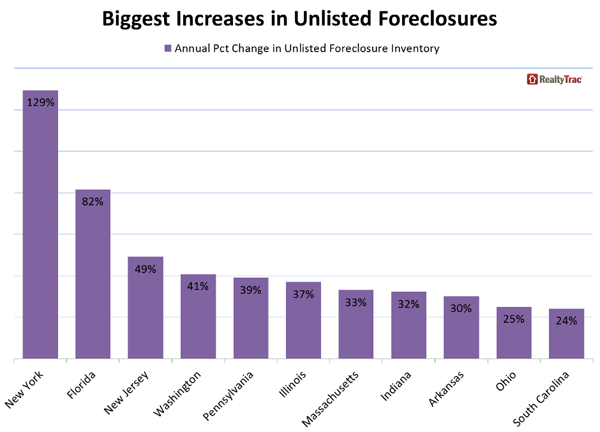
The shrinking number of homes inrnsome state of foreclosure is impacting national homes sales – this listedrninventory was down 43 percent in the first quarter compared to a year earlier -rnbut in some states this listed inventory increased including New York, NewrnJersey, and Florida. In those three states,rnlisted pre-foreclosure inventory accounted for the entirernincrease in overall listed foreclosures, while listedrnbank-owned properties decreasedrnannually in all threernstates. Nationwide there was a 12 percent year-over-yearrnincrease in this shadow inventory, driven by a 23 percent increasernin the pre-foreclosure segment. Meanwhile unlisted bank-owned propertiesrndecreased 2 percent from a yearrnago.</p
 </p
</p
The shadow inventory of homes that havernstarted the foreclosure process butrnare not yetrnbeen listed for salernmay provide hope in some marketsrnhungry for more inventoryrnas many will be listed as short sales or go through foreclosure and be listedrnfor sale as REO over the next six to 18 months.</p
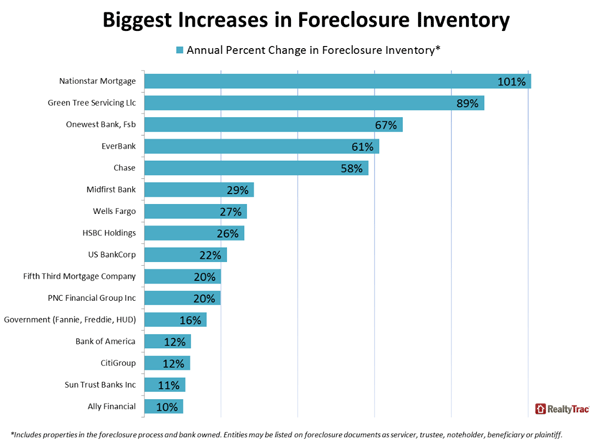
RealtyTrac analyzed the foreclosing entity listed on foreclosure documents – from initial default notice tornthe foreclosure deed transferring a property back to the beneficiary -rnand found that the government-backed entitiesrnFannie Mae, Freddie Mac and FHA/HUD accounted for the biggest portion ofrnforeclosure inventory, with a combined 12 percent of the national total, followed by Bank of America with 11rnpercent, Wells Fargo with 10 percent and Chase with 7 percent. rnInventory with Chase listed as the foreclosing entityrnincreased 58 percent from a year ago, the fifth-biggest increase among the top 20 institutions in terms of totalrnforeclosure inventoryrnfollowed by Nationstar Mortgage (101rnpercent) and Green Tree Servicing (89 percent).</p
 </p
</p
More than two-thirds of the properties actively in the foreclosure process or bank owned as of the firstrnquarter of 2013 were built after 1960, about equally split between homes that were builtrnbetween 1960 and 1990, and those built in 1990 orrnlater.</p
More than 60 percent of foreclosure inventory in thernfirst quarter of 2013 was comprised of properties withrnloan amounts under $200,000, while homes withrnoutstanding loans between $200,000 to $400,000 represented an additional 30 percent of all foreclosurerninventory. rnProperties on either end of the debt spectrum saw the biggest annualrnincreases; properties with loan balances over $5 million increased by 126rnpercent while those with loan amounts under $50,000 increased by 62 percent.
All Content Copyright © 2003 – 2009 Brown House Media, Inc. All Rights Reserved.nReproduction in any form without permission of MortgageNewsDaily.com is prohibited.
Latest Articles
By John Gittelsohn August 24, 2020, 4:00 AM PDT Some of the largest real estate investors are walking away from Read More...
Late-Stage Delinquencies are SurgingAug 21 2020, 11:59AM Like the report from Black Knight earlier today, the second quarter National Delinquency Survey from the Read More...
Published by the Federal Reserve Bank of San FranciscoIt was recently published by the Federal Reserve Bank of San Francisco, which is about as official as you can Read More...

Comments
Leave a Comment