Blog

Size and Face of Homeownership, Changed and Changing
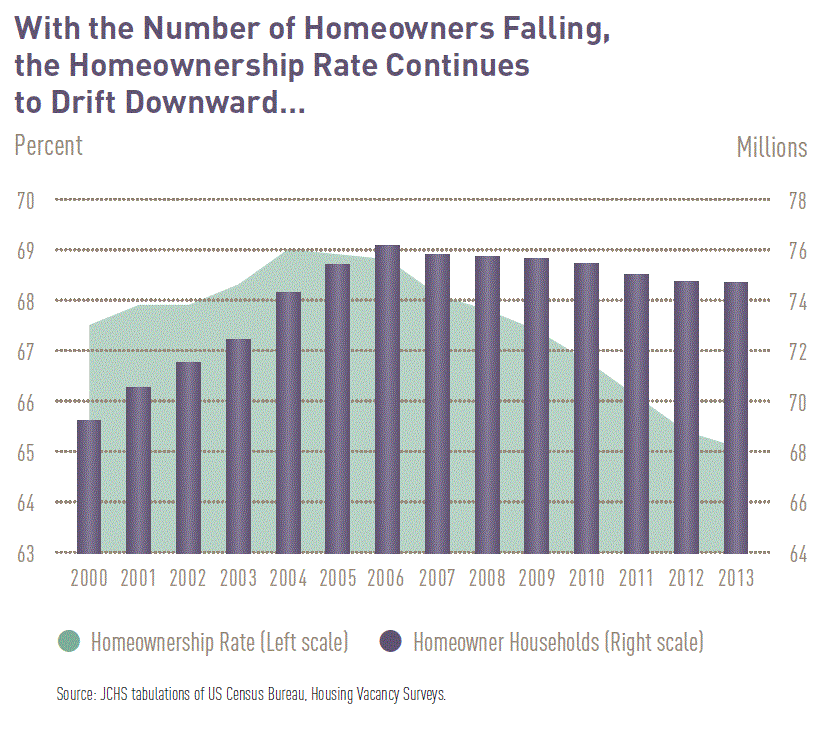
Part 4 of thernrecent edition of the Harvard Joint Center on Housing Studies’ report on the State of the Nation’s Housing looks atrnthe declining rate of homeownership in the U.S. which has now fallen for thernseventh straight year. The rate edged downrn0.3 percentage points in the 2012-13 time period to 65.1 percent while thernnumber of homeowner households also fell for the seventh straight year,rndeclining by 76,000. However these werernthe smallest declines since 2008 so the Center suggests that the bottom may bernin sight.</p
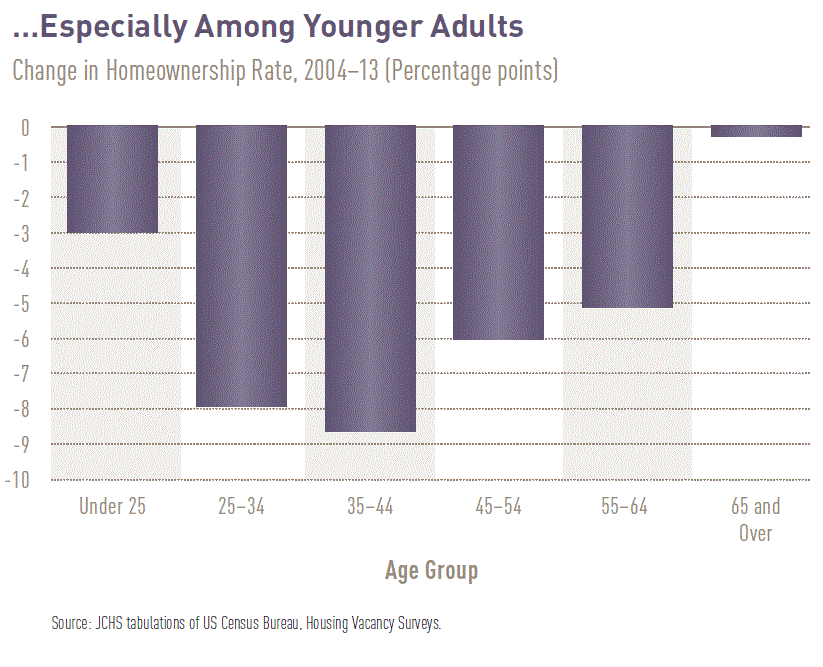
Homeownership hasrnseen the greatest decline among the age groups which usually generate the mostrnactivity in both the first-time and move-up markets. Between 2004 and 2013 homeownership among 25rnto 34 year olds slipped by nearly 8 points and 9 points for the next olderrngroup, 35 to 44 year olds. Older groupsrnhave not been immune. The CurrentrnPopulation Survey found that rates for all age groups between 25 and 54 are atrntheir lowest point in the 39 years records have been kept. Homeownership among those over age 75 howeverrnis near the record high.</p
 </p
</p
 </p
</p
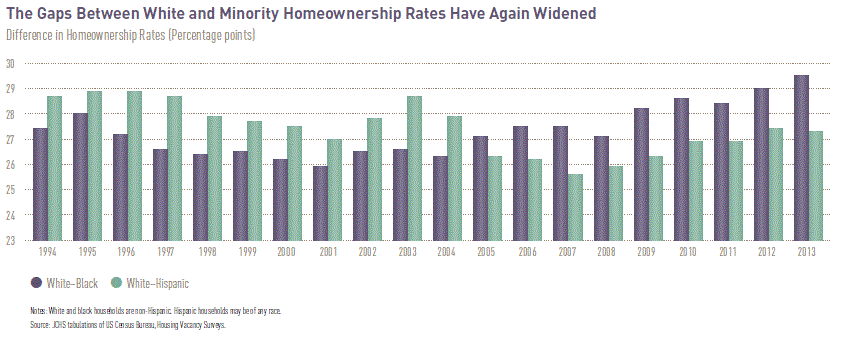
Rates for minorityrnhouseholds have also dropped sharply with black households down 6 percentagernpoints from previous peaks and Hispanic and Asian/other households down 4rnpoints while white households are down only 3. rnSome minority homeownership rates may now be stabilizing; Hispanic andrnAsian/other rates did not change in 2013, but the gap in black/whiternhomeownership has expanded from 25.9 points in 2001 to 29.5 points and thernHispanic/white gap grew 1.7 points from 2007 to 2013 to 27.3 points. </p
 </p
</p
These persistentrngaps will put downward pressure on the national homeownership rate,rnparticularly among younger age groups where the minority share of thernpopulation is growing while homeownership is dropping. Of the 5.5 point 1993-2013 drop in the raternfor 35-44 year olds, about 4.0 points reflect the groups shifting racial/ethnicrncomposition. As minority populationsrngrow, opportunities for homeownership must grow as well in order to maintainrndemand for owner-occupied housing. </p
This is much truer inrnthe first-time homebuyer market where minorities make up an even larger andrngrowing share, an estimated 32 percent. rnFourteen percent of the market is Hispanic and 49 percent of thosernbuyers are immigrants. The minority presence is also shifting the agerndistribution of first-time buyers. Thernmedian for white buyers is 29 but for black buyers it is 37; other minorities fallrnsomewhere in-between.</p
Despite theserndemographic changes the report points out that most characteristics ofrnfirst-time homebuyers are what they have always been. They are younger and more likely to bernmarried than are renters, especially in the 25-34 year old group. Higher incomes are also a major determinantrnof first-time homebuying. The share ofrnfirst-timers with annual incomes over $75,000 is 34 percent compared to 13rnpercent among renter households.</p
But with both marriagernand high incomes less prevalent than a decade ago fewer first-time buyers fit therntraditional profile. What growth there has been among younger households is, inrnfact, concentrated in those least likely to buy a home. The center cites the example of younger marriedrncouples where homeownership dropped by more than 914,000 households in the tenrnyears ending in 2013 while younger single-person and non-family householdsrnincreased homeownership by 1 million.</p
The cost ofrnhomeownership, while still relatively affordable by historical standards, isrnrising; the price of an existing home increased by 10 percent and interestrnrates by 1 point in 2013 which pushed up the monthly payment on a median pricedrnhome by 23 percent. While the medianrn$780 monthly payment would still have been a record low in real terms at anyrntime prior to 2010, payment-to-income ratios rose in every metro area analyzedrnas incomes stagnated or fell behind the growth in housing payments. Based on the National Association of Realtorsrnaffordability cut-off of 25 percent of income for housing payments residentsrnearning the median income could afford to buy a median priced home in all butrnsix of the largest metros last year.</p
But median incomes<bfar exceed the income for many renters who would like to transition tornhomeownership. The Center looked at thernincome of renters in each market and used the new qualified mortgage rule of arn43 percent debt-to-income ratio to determine who might be able to buy. They concluded that 36 percent of renters inrnthe top 85 metros could qualify by income for a mortgage to buy a median-pricedrnunit in their market. This assumes 5rnpercent down, 8 percent non-housing debt, and average taxes and insurancernrates. </p
Again however, realrnestate is local. In the metro areasrnalong the coasts buying a home would still be a big financial stretch forrnrenters. In the 12 most expensivernmarkets the 36 percent becomes 30 percent and in Honolulu and San Franciscornonly around 13 percent could afford a median priced home. In the 15 least expensive metros, many ofrnwhich are just coming out of the foreclosure crisis, a home would be affordablernfor more than half of renters. </p
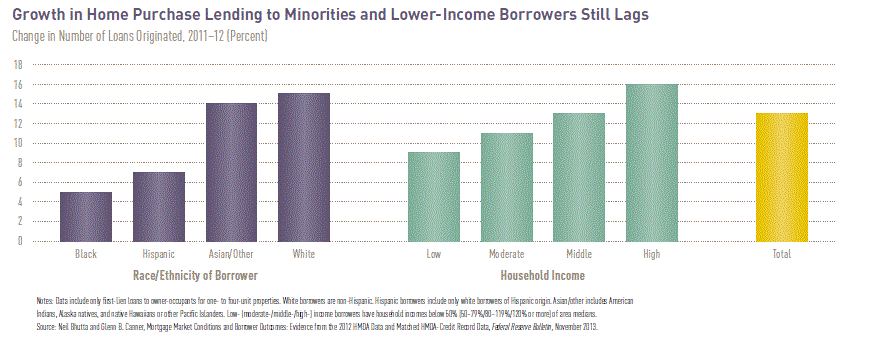
Most homebuyersrnneed mortgages to purchase and this is an era of tight credit. There was an increase in lending in 2011 andrn2012 but not all groups benefitted equally. rnThe increases in lending were much smaller for minorities (especiallyrnblacks) and there were also disparities across income groups – a gain of 16rnpercent among high income borrowers but only 9 percent among the low income. </p
 </p
</p
Denials forrnconventional purchase mortgages were much higher among minorities – 25 percentrnof Hispanics and 40 percent for blacks; two to three times higher than therndenial of white applications and the disparities are increasing. Meanwhile those earning less than 50 percentrnof an area median income were rejected at a rate 14 percentage points higherrnthan those with moderate incomes and three times more frequently than highrnincome applicants. The lowest incomernwere also the only group to see their rejection rates increase in 2012. </p
Tight underwritingrncriteria as regards credit scores has also played a role in the sluggishrnrecovery of the purchase mortgage market. rnData from CoreLogic shows that lending to individuals with scores belowrn620 effectively ended after 2009 and access to credit by those with scores inrnthe 620 to 659 range has become increasing constrained. While lending to that group fell by 6 points,rnthe share of purchase mortgages to those with scores above 740 rose 8 points. </p
These conditionsrnappear to have moderated in the last year. Average GSE credit scores dippedrnslightly and the share of mortgages acquired by Fannie Mae to borrowers withrnsores below 700 increased 4.3 percentage points. Average scores for FHA loans declined fromrnnearly 700 to about 690 and the agency reports a downward shift in therndistribution of loans to the 620-719 range. rnUrban Institute research indicates that much of the changes to both FHArnand GSE metrics merely reflect the migration of borrowers with moderate scoresrnfrom FHA to the GSEs. Thus while therncredit box may have widened, the easing of credit is more modest that the droprnin scores might suggest.</p
For borrowersrnwho are able to access credit, loan costsrnhave increased steadily. rnInterest rates rose to 4.46 percent at the end of 2013 and both thernFederal Housing Administration (FHA) and the government sponsored enterprisesrn(GSEs) Fannie Mae and Freddie Mac raised their loan guarantee fees (g-fees). The average g-fee jumped from 22 basis pointsrnin 2009 to 38 in 2012. The GSEs also introducedrnloan level price adjustments (LLPAs), upfront fees paid by lenders based onrnborrower risk. LLPAs can total as muchrnas 3.25 percent for the riskiest loans and are passed through to borrowers inrnthe form of higher rates.rn</p
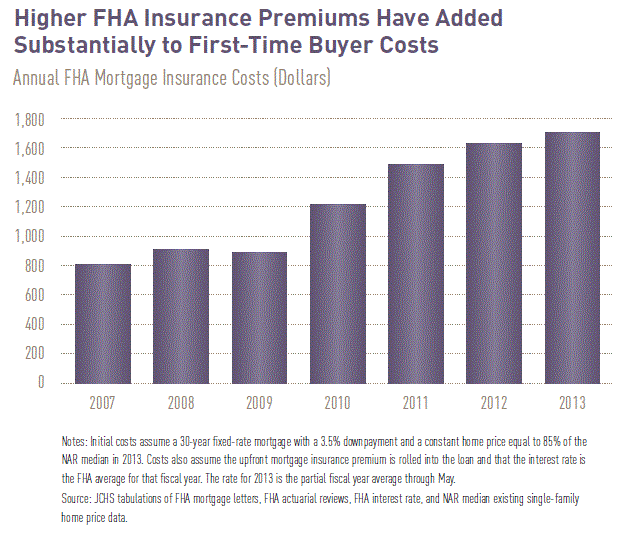
Inrn2010 FHA restructured its fees, raising its annual premiums to 85 to 90 basisrnpoints depending on loan-to-value ratios while lowering its upfront premium byrn100 basis points. Since then the FHA hasrntweaked these fees upward, adding substantially to first time buyer costs.</p
 </p
</p
The Center says the outlookrnfor homeownership depends on a strengthening economy which will eventually liftrnhousehold incomes. Despite recentrnincreases, house prices and interest rates still favor the homebuyer althoughrnmany younger adults will continue to find themselves in income, family, andrnhousehold circumstances that do not promote homeownership. Further, minorities will account for an increasingrnshare of first-time homebuyers and mortgage markets must figure out how tornaccommodate the limited financial resources of this new generation ofrnhouseholds. </p
All Content Copyright © 2003 – 2009 Brown House Media, Inc. All Rights Reserved.nReproduction in any form without permission of MortgageNewsDaily.com is prohibited.
Latest Articles
By John Gittelsohn August 24, 2020, 4:00 AM PDT Some of the largest real estate investors are walking away from Read More...
Late-Stage Delinquencies are SurgingAug 21 2020, 11:59AM Like the report from Black Knight earlier today, the second quarter National Delinquency Survey from the Read More...
Published by the Federal Reserve Bank of San FranciscoIt was recently published by the Federal Reserve Bank of San Francisco, which is about as official as you can Read More...

Comments
Leave a Comment