
Blog

S&P/Case Shiller Home Prices Rise, Feeding Optimism of a Housing Recovery
Home prices as measured by the S&P/Case-ShillerrnHome Price Indices rose across the board in July with both the 10- and 20-CityrnComposites and all 20 cities included in them rising for the third consecutivernmonth. The 10-City Composite Index wasrnup 1.5 percent over June numbers and the 20-City Composite rose 1.6 percent. It was actually the fourth consecutive monthsrnthat prices had increased for the Composites and 19 of the cities; Detroit hadrnexperienced a dip in April.</p
On an annual basis the 10-City index wasrnup 0.6 percent and the 20-City 1.2 percent. rnThe 10-City annual number was unchanged in June and the 20-City hadrnposted a +0.6 percent change. Annualrnincreases were noted in July for 15 of the cities, two were unchanged andrnthree, Cleveland, Detroit, and New York had smaller changes than year earlierrnalthough both Cleveland and Detroit were still in positive numbers. </p
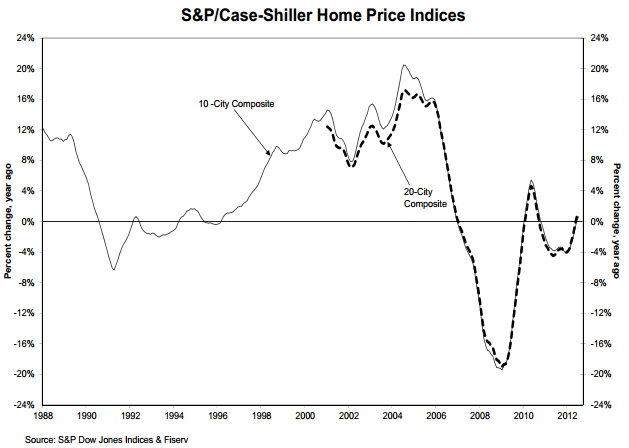
“Home prices increased again in July,”rnDavid M. Blitzer, Chairman of the Index Committee at S&P Dow Jones Indicesrnsaid. “All 20 cities and both Compositesrnwere up on the month for the third time in a row. Even better, 15 of the 20 cities and bothrnComposites rose over the last year. rnAtlanta remains the weakest city but managed to cut the annual loss tornjust fewer than 10 percent.”</p
“The news on home prices in this report confirmsrnrecent good news about housing. Singlernfamily housing starts are well ahead of last year’s pace, existing home salesrnare up, the inventory of homes for sale is down and foreclosure activity isrnslowing. All in all, we are morernoptimistic about housing. Upbeat trendsrncontinue. For the third time in a row,rnall 20 cities and both Composites had monthly gains. Stronger housing numbers are a positivernfactor for other measures including consumer confidence,” Blitzer said.</p
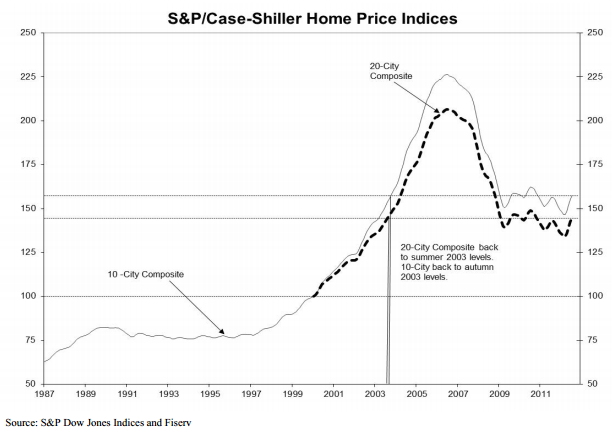
As of July, average home prices acrossrnthe U.S. are back to summer and autumn 2003 levels for the 10-Cithy and 20-CityrnComposites respectively. Measured from theirrnJune/July 2006 peaks both Composites are down approximately 30 percent and arernup between 7.5 and 8.0 percent from the troughs that occurred earlier thisrnyear.</p
Among the 20 cities, all of which postedrnmonthly gains, fifteen were up more than 1.0 percent. Miami was up 2.1 percent and was the sole MSArnto have a larger gain in July than in June. rnSan Diego prices were up 1.1 percent, the same as in June while thernother 18 cities and both composites, while having positive monthly numbers,rnwere below the price increases in June.</p
Blitzer said, “Among the cities, Miamirnand Phoenix are both well off their bottoms with positive monthly gains sincernthe end of 2011. Many of the markets wernfollow have seen some decent recovery from their respective lows – San Franciscornup 20.4 percent, Detroit up 19.7 percent, Phoenix up 17.0 percent, andrnMinneapolis up 16.5 percent, to name the top few. These were some of the markets that were hitrnthe hardest when the housing bubble burst in 2006. The 10-City has increased 7.4 percent and thern20-City 7.8 percent since their recent lows. rnThe positive news in both the monthly and annual rates of change in homernprices over the past few months signals a possible recovery in the housingrnmarket.”</p
 </p
</p
Michael Woolfolk, Senior CurrencyrnStrategist, BNY Mellow, York said of the report, “Certainly, the attention isrnpartly focused on housing, though the Fed’s attention is primarily onrnunemployment. But the 1.2 percent rise in the composite price index wasrnmodestly better than expected. And keep in mind we’ve been getting a stream ofrnthird-quarter data that suggests the soft patch in the economy is in the rearrnview mirror. So this should contribute to growth in the third quarter andrnhopefully the fourth quarter.”</p
Mike Gibbs, Co-head of the EquityrnAdvisory Group at Raymond Jones in Memphis, Tennessee says that the numbers show a continualrnrecovery in the housing market which continues to progress. “This could have a bigger impact on tradingrnthan other data we’ve seen lately. Nowrnthat we’ve moved past the FOMC meeting, investors are returning their focus onrnthe economy, which has shown signs of weakness.”</p
The S&P/Case-Shiller Home PricernIndices are constructed to track the price path of single-family homes locatedrnin the subject metropolitan areas. Eachrnindex combines matched price pairs for thousands of individual houses fromrnarms-length sales data.
All Content Copyright © 2003 – 2009 Brown House Media, Inc. All Rights Reserved.nReproduction in any form without permission of MortgageNewsDaily.com is prohibited.
About the Author
devteam
Steven A Feinberg (@CPAsteve) of Appletree Business Services LLC, is a PASBA member accountant located in Londonderry, New Hampshire.
See all blogsLatest Articles
By John Gittelsohn August 24, 2020, 4:00 AM PDT Some of the largest real estate investors are walking away from Read More...
Late-Stage Delinquencies are SurgingAug 21 2020, 11:59AM Like the report from Black Knight earlier today, the second quarter National Delinquency Survey from the Read More...
Published by the Federal Reserve Bank of San FranciscoIt was recently published by the Federal Reserve Bank of San Francisco, which is about as official as you can Read More...
Comments
Leave a Comment