
Blog

Unintended Consequences of Judicial vs Non-Judicial Foreclosure
The Lender Processing Services (LPS)rnMortgage Monitor for January which was released on Thursday takes a detailedrnlook at what it calls the “Time to Clear” default backlog and what might berntermed the unintended consequences of legislative or judicial action in a fewrnstates. The report shows the nowrnwell-known divergence in the foreclosure pipelines of states that use judicialrnand non-judicial foreclosure processes but, as its Senior Vice President HerbrnBlecher says, even this now-familiar judicial/non-judicial dichotomy is not asrnclearly defined as it once was. </p
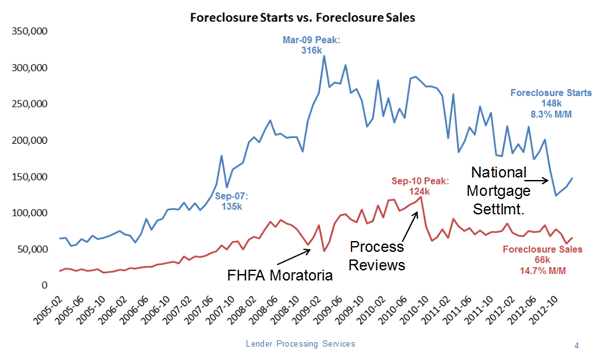
While the overall trend of foreclosurernactivity has heading downward for months, January had one of the frequent upwardrnblips. There were a total of 148,000rnforeclosure starts in January, an increase of 8.3 percent from December, andrn66,000 foreclosure starts, up 14.7 percent from the previous month. </p
Foreclosure inventories have beenrndeclining slowly since 2009 and the national inventory or pipeline now standsrnat 3.41 percent. The inventory inrnjudicial process states is 5.69 percent, nearly three times that ofrnnon-judicial states where the percentage of homes in some stage of foreclosurernis 1.79 percent. Further, the percent ofrnloans in the pipeline that have been delinquent in excess of two years is 58rnpercent in judicial states as opposed to 33 percent in non-judicial states.</p
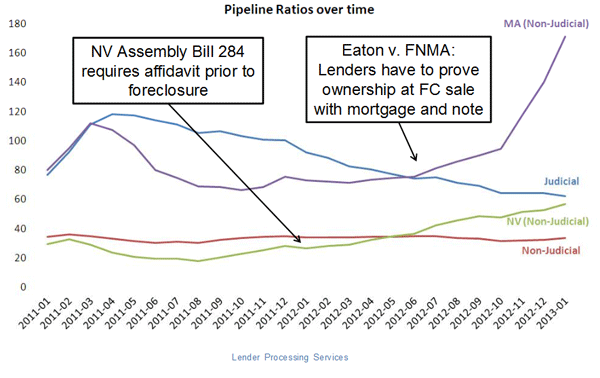
The Monitor points to two non-judicialrnstates where pipelines have increased dramatically in recent months due inrnNevada to legislative action and to the results of a court decision inrnMassachusetts. The extent of the Massachusettsrnshift, apparently because of a requirement that the lender must now provernownership of the loan it is foreclosing, raises questions about therncircumstances surrounding foreclosures prior to Eaton V FNMA. ThernMonitor asks, given the results in these two states, about the potential impactrnof the new Home Owners’ Bill of Rights recently enacted in California.</p
 </p
</p
Blecher said, “On average, pipeline ratios — the rate at which states arerncurrently working through their existing backlog of loans either in foreclosurernor serious delinquency — are almost twice as high in judicial states thanrnnon-judicial states. At today’s rate of foreclosure sales, it will take 62rnmonths to clear the inventory in judicial states as compared to 32 months inrnnon-judicial states. A few judicial states — New York and New Jersey inrnparticular — have such extreme backlogs that their problem-loan pipelinesrnwould take decades to clear if nothing were to change.</p
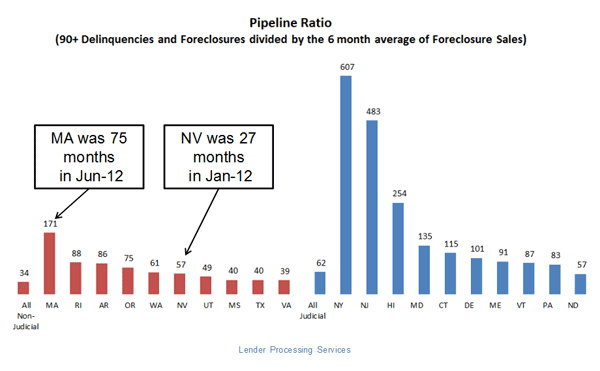 <br /<br /"More recently, certain non-judicial states, such as Massachusetts andrnNevada, have enacted ‘judicial-like’ legislative and/or legal actions whichrnhave greatly extended their pipeline ratios. Nevada’s ‘time to clear’ hasrnextended from 27 months in January 2012 to 57 months as of January 2013. Thernchange in Massachusetts has been even more pronounced. Since June of last year,rnits pipeline ratio has gone from 75 to 171 months.”</p
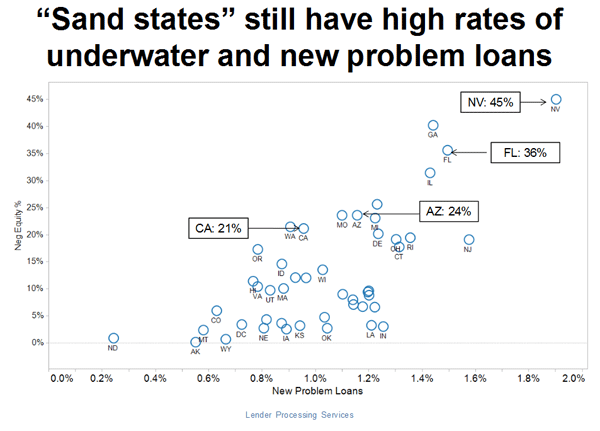
The total U.S. delinquency rate inrnJanuary was 7.03, down 2.03 percent from December. The January data also showed that, despite anrnoverall national trend of improvement, new problem loan rates remain high inrnstates with large numbers of “underwater” borrowers. So-calledrn”sand states,” such as Nevada, Florida and Arizona, are still seeingrnhigh levels of negative equity (45, 36 and 24 percent of borrowers arernunderwater, respectively), and each of those states is experiencingrnhigher-than-average levels of new problem loans. Additionally — and furtherrnunderscoring the differences seen between judicial and non-judicial states –rnnew problem loan rates in non-judicial states declined slightly over the lastrnsix months, while increasing almost 20 percent in judicial states.</p
 </p
</p
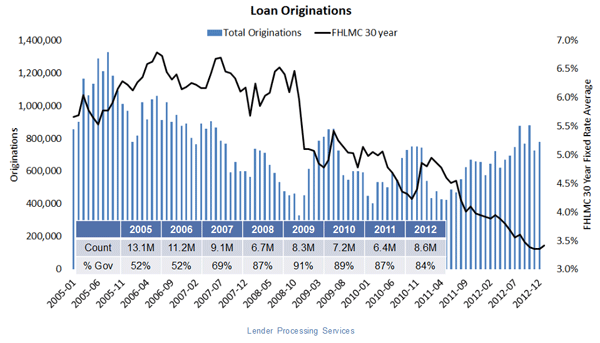
LPS reported, based on December data,rnthat loan originations remained elevated but did not move as significantly asrnmight have been expected with the continued declines in interest rates. Credit characteristics for recent vintagesrnof loans are what it called “pristine” with low default rates and have lowerrnrisk with higher margins.</p
 </p
</p
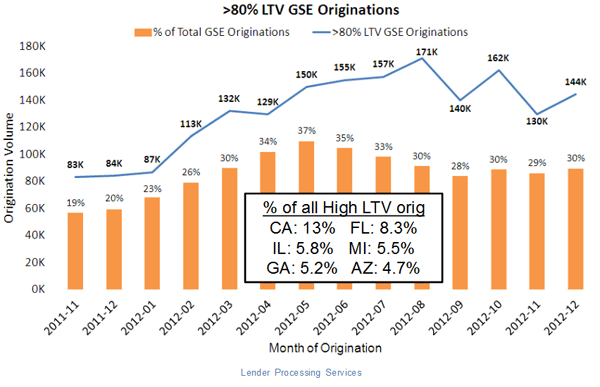
Refinancing through the Home AffordablernRefinance Program (HARP) continues strong, representing almost a quarter of allrnoriginations and about 30 percent of originations done through Freddie Mac andrnFannie Mae. </p
 </p
</p
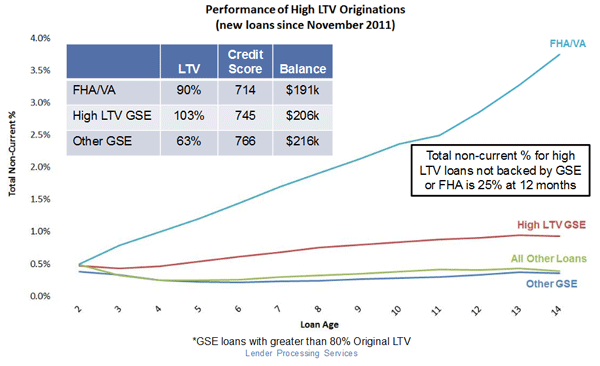
Despite the high loan-to-value ratios ofrnHARP loans the default rates remain low compared to FHA and other high ratiornloans although LPS is extrapolating this conclusion from high LTV loans by therngovernment sponsored enterprises (GSEs) that it presumes to be HARP loans. </p
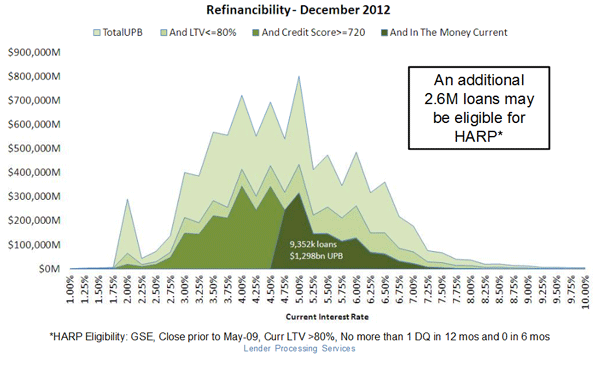
<br /LPSrnsays as many as 20 percent of outstanding mortgages – or approximately 2.6rnmillion – have refinancable characteristics and could benefit from refinancing throughrnHARP or some other program.</p
All Content Copyright © 2003 – 2009 Brown House Media, Inc. All Rights Reserved.nReproduction in any form without permission of MortgageNewsDaily.com is prohibited.
About the Author
devteam
Steven A Feinberg (@CPAsteve) of Appletree Business Services LLC, is a PASBA member accountant located in Londonderry, New Hampshire.
See all blogsLatest Articles
By John Gittelsohn August 24, 2020, 4:00 AM PDT Some of the largest real estate investors are walking away from Read More...
Late-Stage Delinquencies are SurgingAug 21 2020, 11:59AM Like the report from Black Knight earlier today, the second quarter National Delinquency Survey from the Read More...
Published by the Federal Reserve Bank of San FranciscoIt was recently published by the Federal Reserve Bank of San Francisco, which is about as official as you can Read More...
Comments
Leave a Comment